
FIGURE 2.
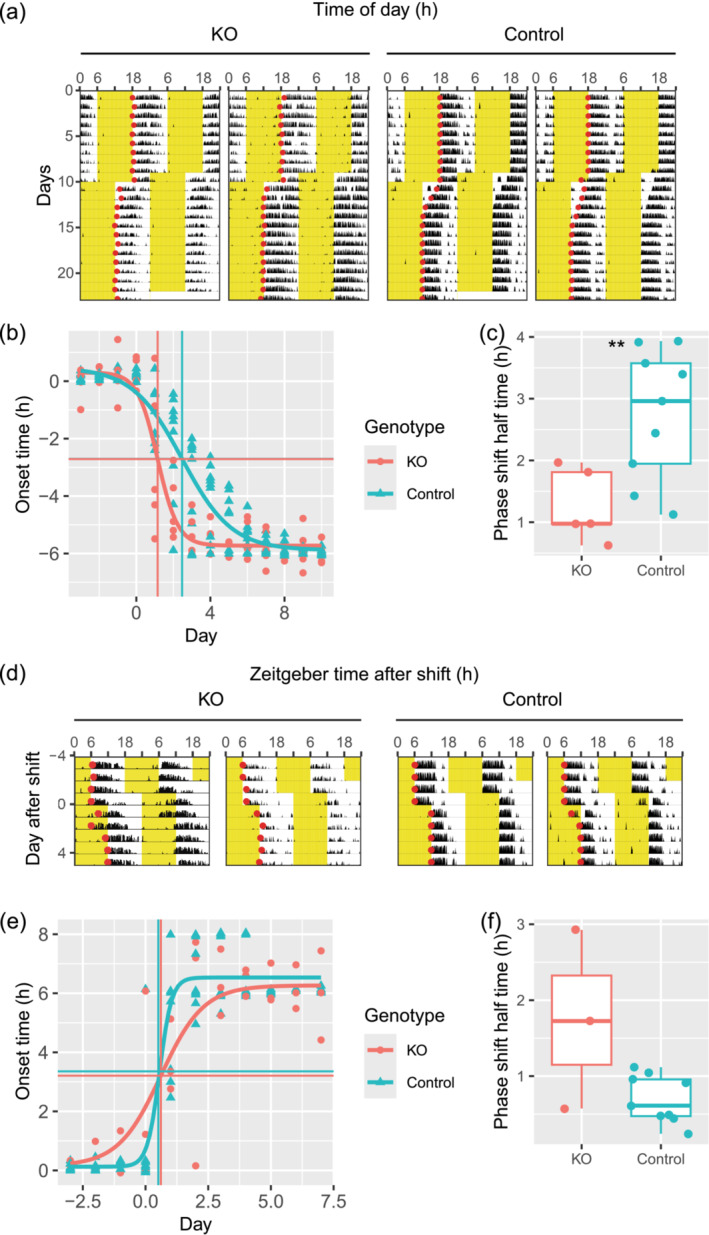
Conditional Dicer knockouts re‐entrain faster to jetlag. (a) Representative actograms with detected onsets (red circles) under 6 h‐advance jetlag. Yellow part in the actograms denotes when light was on. (b) Activity onsets under 6 h‐advance jetlag was plotted against day since jetlag. Y‐axis shows onset time with ZT12 before jetlag as time 0. X‐axis shows the day since jetlag with day 0 as the day when the light was shifted 6 h in advance. The fitted curve shows the dynamic of onset time for the whole animal population. The vertical lines show the phase‐shift half‐time of the population calculated from the fit. The horizontal lines show the corresponding onset times calculated from the fit. (c) Phase shift half time of 6 h‐advance jetlag calculated for each animal separately. (d) Representative actograms with detected onsets (red circles) under 6 h‐delay jetlag on day 0. Yellow part in the actograms denotes when light was on. (e) Activity onsets under 6 h‐delay jetlag was plotted against day since jetlag. Y‐axis shows onset time with ZT12 before jetlag as time 0. X‐axis shows day since jetlag with day 0 as the day when the light was shifted 6 h delay. The fitted curve shows the dynamic of onset time for the whole animal population. The vertical lines show the phase‐shift half‐time of the population calculated from the fit. The horizontal lines show the corresponding onset times calculated from the fit. (f) Phase shift half time of 6 h‐ delay jetlag calculated for each animal separately. **: p < 0.01.