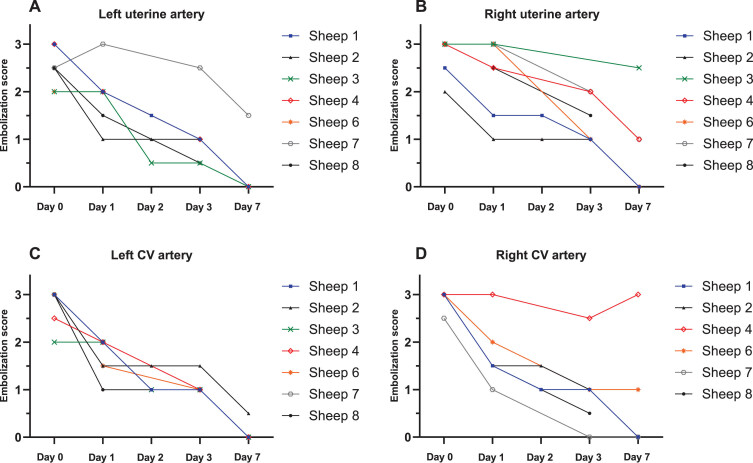
Fig. 3.
The embolization score over the observation period is shown in the graphs for the left (A) and right (B) uterine arteries and for the left (C) and right (D) cervicovaginal (CV) branches in Table 4. Sheep 3 is not shown in (D) because there are no data available; see the text for details.

