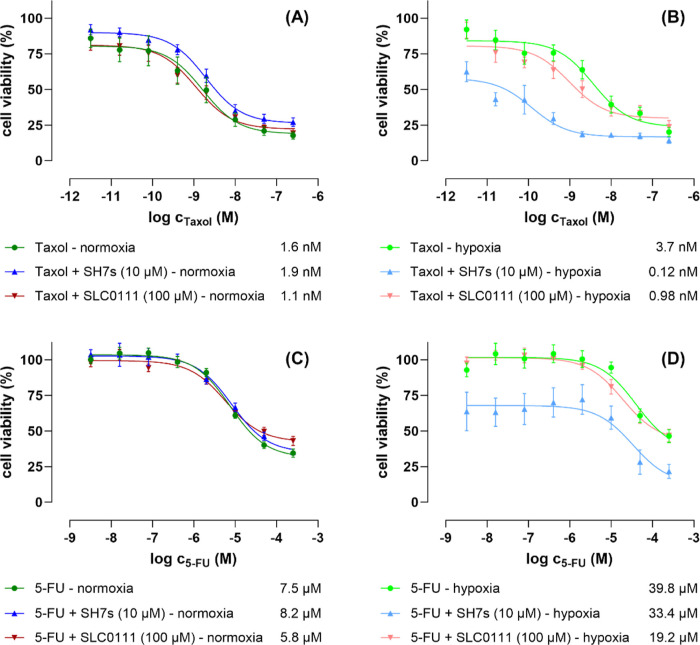
Figure 6.
Dose–response curves of the antiproliferative/cytotoxic effects of the clinically approved anticancer drugs Taxol (paclitaxel) (A,B) and 5-fluorouracil (5-FU) (C,D) on human HCT-116 colorectal cancer cells, measured after 48 h single treatment and cotreatments with SH7s (fixed concentration 10 μM) and SLC-0111 (fixed concentration 100 μM), under both normoxic (A,C) and hypoxic (B,D) cell culture conditions, by conducting fluorometric resazurin-based cell viability assays. The data represent three biological replicates each comprising technical triplicates. The given values are relative IC50 values, the standard errors are expressed as ±SEM. Data analysis was done by using GraphPad Prism 10.1 software.

