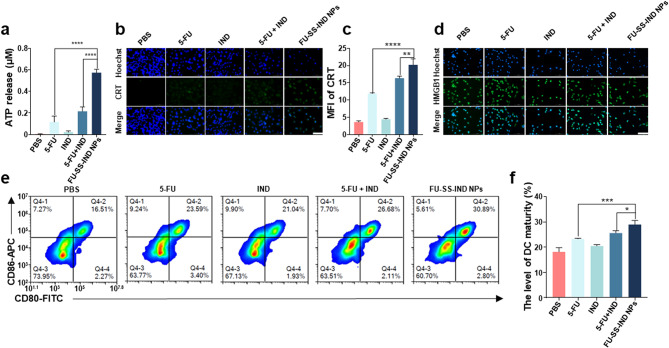
Fig. 5.
In vitro ICD induction and immune activation after various stimulations. (a) The ATP release from Hepal-6/FU cells post culture with PBS (control group), free 5-FU, free IND, 5-FU + IND, and FU-SS-IND NPs for 48 h. Immunofluorescence assessment of (b) CRT exposure and (d) HMGB1 release on Hepa1-6/FU cells following various treatments for 48 h. Scale bar: 100 μm (Nuclei, DAPI, blue; CRT/HMGB1, Alexa 488, green). (c) MFI statistical results of (b). (e, f) FCM analysis of DCs maturing rate following co-incubation with various treated Hepa1-6/FU cells for 24 h. n = 3, *p < 0.05; **p < 0.01; ***p < 0.001, ****p < 0.0001

