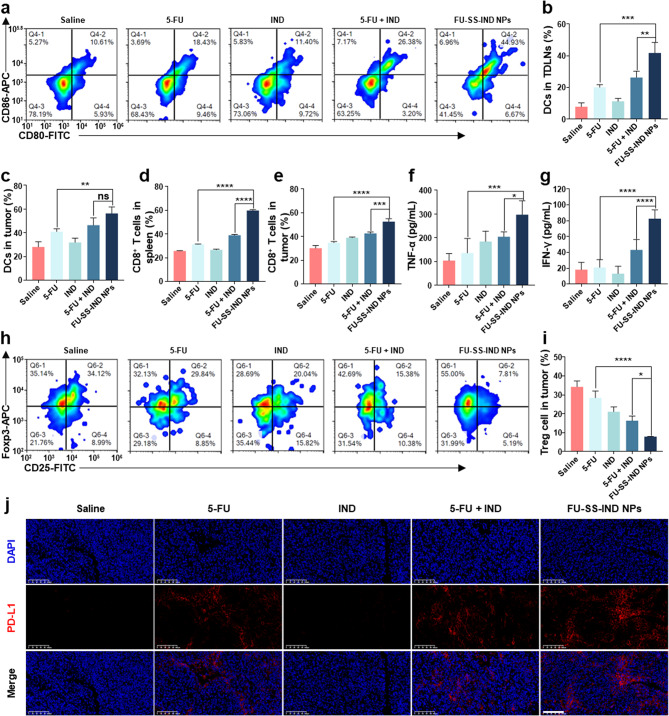
Fig. 8.
In vivo assessment of the antitumor immunity efficiency. (a, b) FCM profiles and quantitative statistics of mature DCs in TDLNs with different therapies. FCM quantitative statistics indicating the maturity rate of (c) DCs in tumors following various treatments. FCM evaluation of the proportions of CD8+ T cells in the (d) spleens and (e) tumors following various treatments. Immunological parameters: enzyme-linked immunosorbent assay (ELISA) was employed to quantify serum levels of cytokines, including TNF-α (f), and IFN-γ (g). (h, i) FCM profiles and quantitative analyses of Tregs in the tumors following various treatments. (j) Immunofluorescence staining of PD-L1 levels in Hepa1-6/FU tumors after treatment with saline, 5-FU, IND, 5-FU + IND and FU-SS-IND NPs. Scale bar: 100 μm. n = 3, *p < 0.05; **p < 0.01; ***p < 0.001; ****p < 0.0001; ns, not significant

