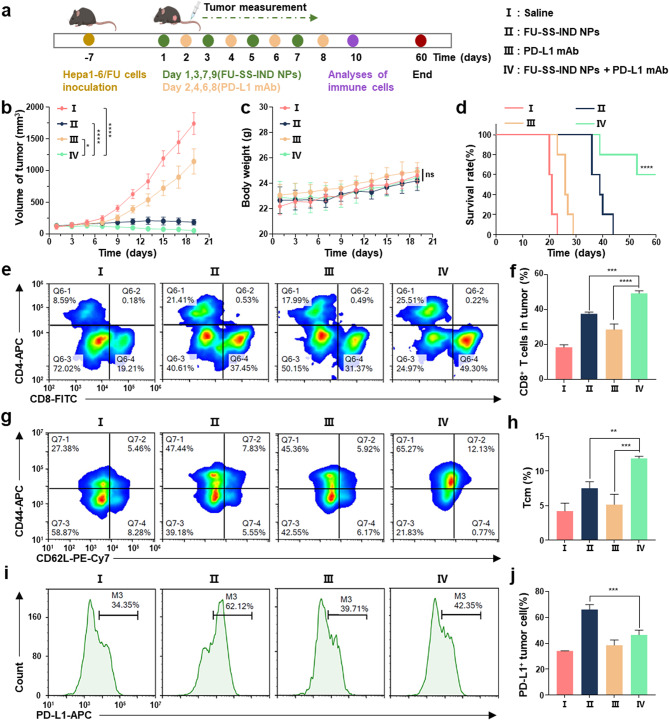
Fig. 9.
Evaluation of the in vivo anticancer and immunological efficacy of FU-SS-IND NPs plus PD-L1 mAb. (a) Schematic illustration of administration. (b) Volumes of tumors, (c) body weights and (d) survival curves of 5-FU-resistant tumors mice treated with saline, FU-SS-IND NPs, PD-L1 mAb and FU-SS-IND NPs + PD-L1 mAb. (e, f) FCM profiles and quantification of CD8+ T cells in tumors with various treatments. (g, h) FCM profiles and quantification of Tcm in spleens with different treatments. (i, j) FCM analysis and quantification of PD-L1 expression in tumors of mice following various treatment groups. n = 3–5, *p < 0.05; **p < 0.01; ***p < 0.001; ****p < 0.0001; ns, not significant

