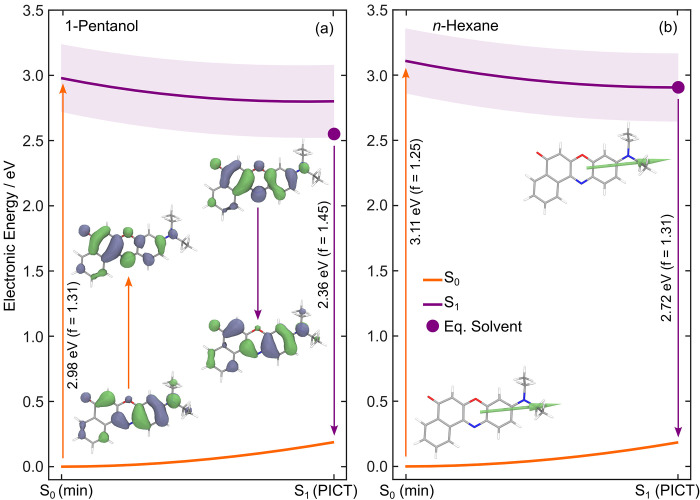
Figure 2.
LIIC pathways connecting the ground-state optimized geometry, S0 (min), to the first excited optimized geometry, S1 (PICT), of Nile Red. Calculations were performed in an implicit solvent model for (a) 1-pentanol and (b) n-hexane. Insets in panel a depict the natural transition orbitals associated with absorption and fluorescence between the S0 and S1 states. In panel b, the transition dipole moments corresponding to the S1←S0 transition at S0 (min) and S1 (PICT) are overlaid on the respective minimum energy structures. The shaded purple area in both panels represents the magnitude of the S1 ← S0 oscillator strength along the LIIC pathway. The large purple dot in each panel corresponds to the solvent relaxed S1 minimum energy calculated using equilibrium IEFPCM. All calculations were performed with DFT/ωB97XD/def2-TZVPP and LR-TDDFT/TDA/ωB97XD/def2-TZVPP using a nonequilibrium IEFPCM solvent model.

