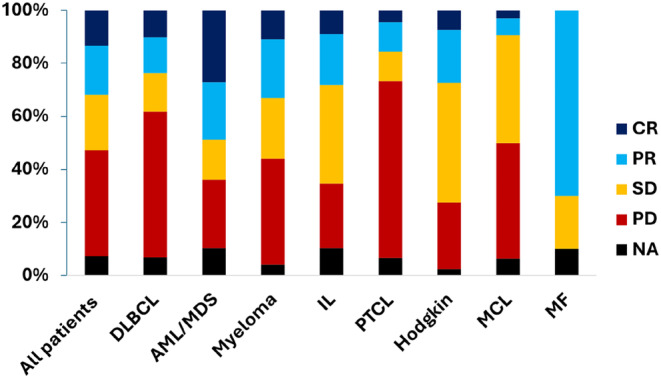
FIGURE 2.

Histogram stacked at 100%, showing the distribution of therapeutic response rates, according to tumor type categories, in patients with hematological cancer participating in early‐phases clinical trials (Phases 1 and 2), between 2008 and 2023. Responses were evaluated by the investigators in each protocol and according to the criteria of each disease and each protocol. For acute leukemia, the complete responses included in this figure the complete response (CR) and the complete responses with incomplete count recovery (CRI). AML, acute myeloid leukemia; CR, complete response; Cri, complete response incomplete count recovery; DLBCL, diffuse large B cell lymphoma; IL, indolent lymphoma; MCL, mantle cell lymphoma; MDS, myelodysplastic syndrome; MF, myelofibrosis; NA, not available; PD, progressive disease; PR, partial response; PTCL, peripheral T cell lymphoma; SD, stable disease.
