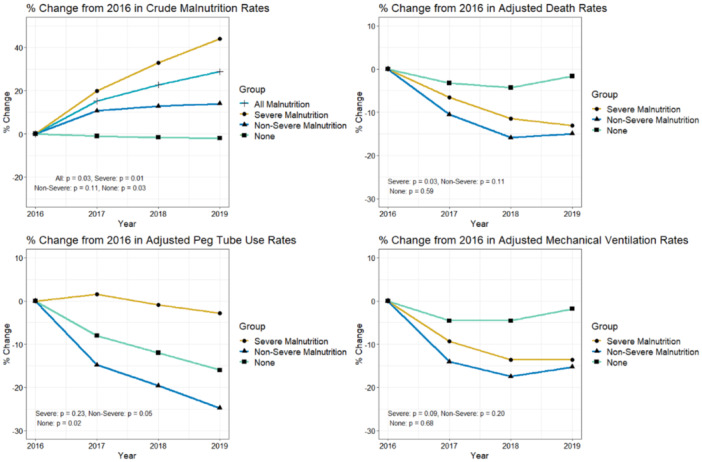
Figure 2.

From left to right, then top to bottom: (1) % change in crude rates of malnutrition diagnoses from 2016. (2) % change in adjusted death rates among malnutrition groups from 2016. (3) % change in adjusted PEG tube use rates among malnutrition groups from 2016. (4) % change in adjusted invasive mechanical ventilation rates among malnutrition groups from 2016. *Analyses for Panel 2, 3, 4 were adjusted for age group, Gagne score quartile, and gender per malnutrition diagnosis category.
