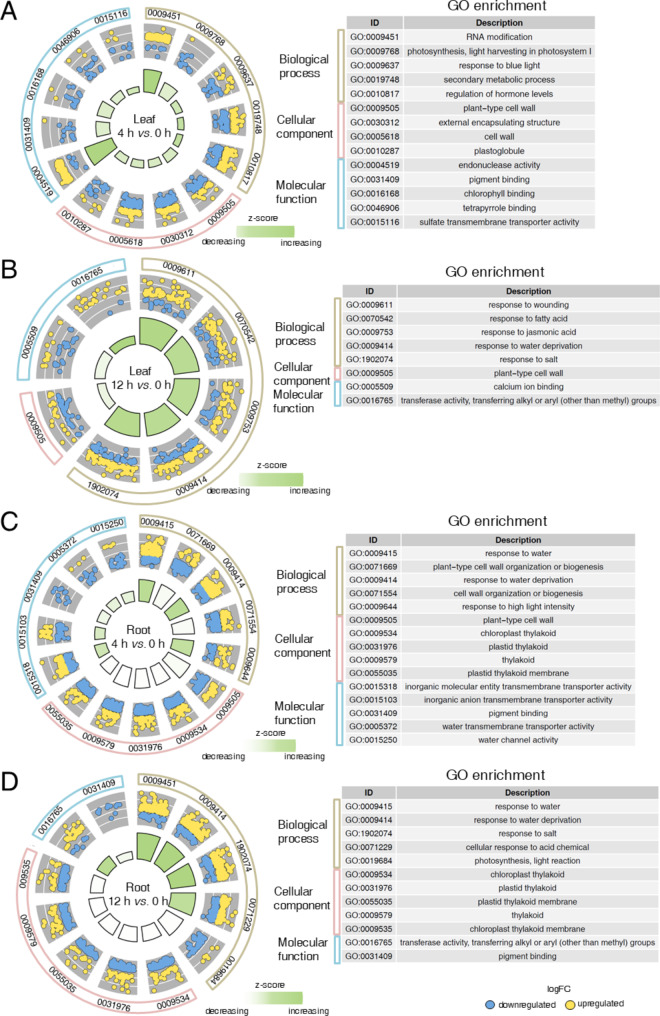
Fig. 2.
Top five GO enrichment circle diagrams for DEGs in response to salt in leaves and roots. A-B Go enrichment circle diagrams for DEGs in response to salt in the leaves for the comparisons of 4 h vs. 0 h (A) and 12 h vs. 0 h (B). C-D Go enrichment circle diagram for DEGs in response to salt in the roots for the comparisons of 4 h vs. 0 h (C) and 12 h vs. 0 h (D). Outside circle: classification of GO categories. Medium circle: enriched dots representing up-regulated genes (yellow) and down-regulated genes (blue) within each category. Inside circles: change trend of each category, represented by z-score

