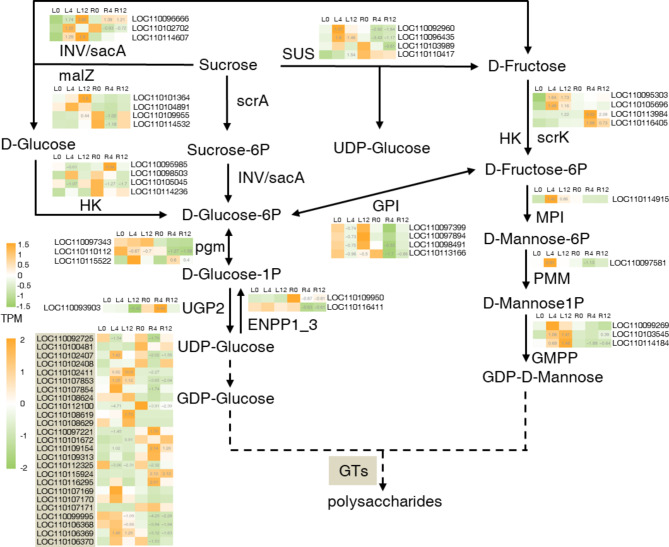
Fig. 4.
Expression profiles of sugar metabolic genes and DoSWEETs in response to salt stress. Each cell represents the mean TPM value derived from three biological replicates. The number in each cell represents the log2FC value compared to the control group (L0 or R0) with a significant level of p < 0.05. L0, L4, and L12 represent leaves treated with salt for 0 h, 4 h, and 12 h, respectively. R0, R4, and R12 represent roots treated with salt for 0 h, 4 h, and 12 h, respectively. Glycosyltransferases (GTs) are marked in light brown

