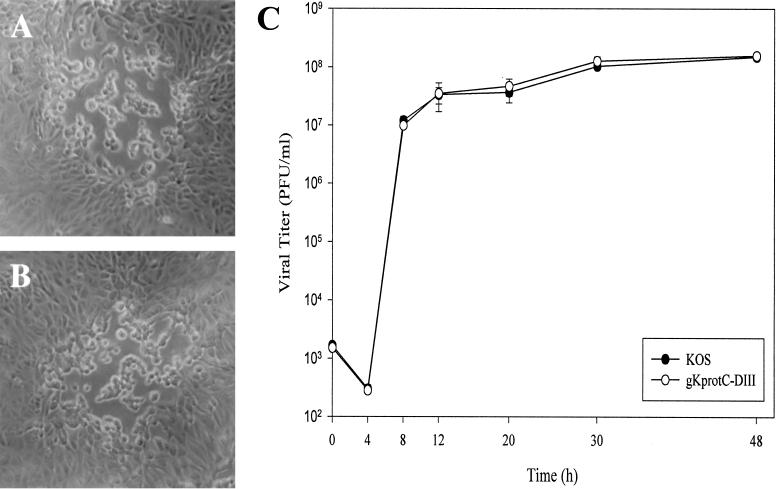
FIG. 2.
Comparison of plaque morphology and replication characteristics of gKprotC-DIII and KOS viruses. Comparison of virus plaque morphologies formed on Vero cells at 48 h postinfection. (A) KOS. (B) gKprotC-DIII. (C) Time-dependent kinetics of infectious virus production after infection of Vero cells at an MOI of 5 and incubation at 37°C. The graph depicts one of three separate experiments with similar results. Each separate experiment was repeated in triplicate to obtain standard deviations.

