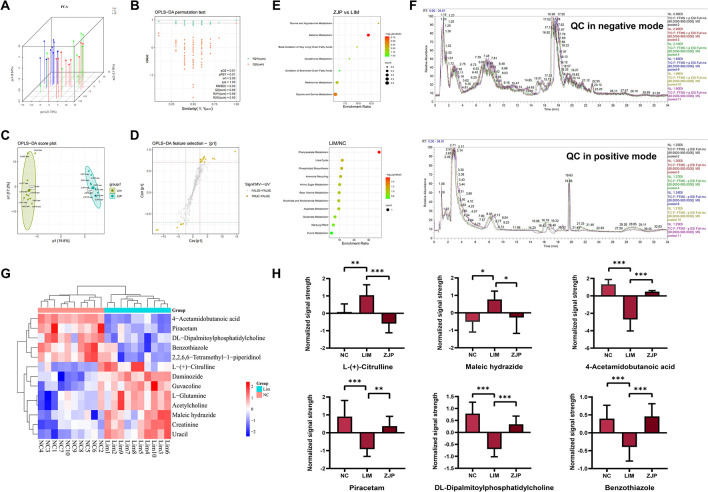
Fig 2. ZJP’s regulatory impact on the metabolic abnormality brought on by LIM.
A, B: Validation plot and PCA score of serum samples obtained from various groups. C, D: Serum sample OPLS-DA score and S-plot from the ZJP and LIM groups. E: KEGG pathway analysis of differential metabolites. F: The total ion chromatogram of QC samples. G: The Cluster-heat map of differential metabolites selected by S-plot using Pearson distance. H: Comparison of the normalized signal strength of potential biomarkers.

