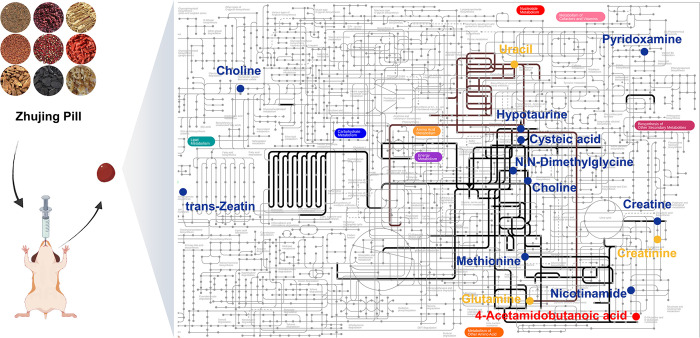
Fig 3. The potential mechanism through which ZJP suppresses myopia progression.
The yellow and blue dots represent differential metabolites between the LIM and NC groups and between the ZJP and LIM groups, respectively. The red dot indicates the intersection of the two. The brown and black lines represent pathways of differential metabolite enrichment between the LIM and NC groups and between the ZJP and LIM groups, respectively.

