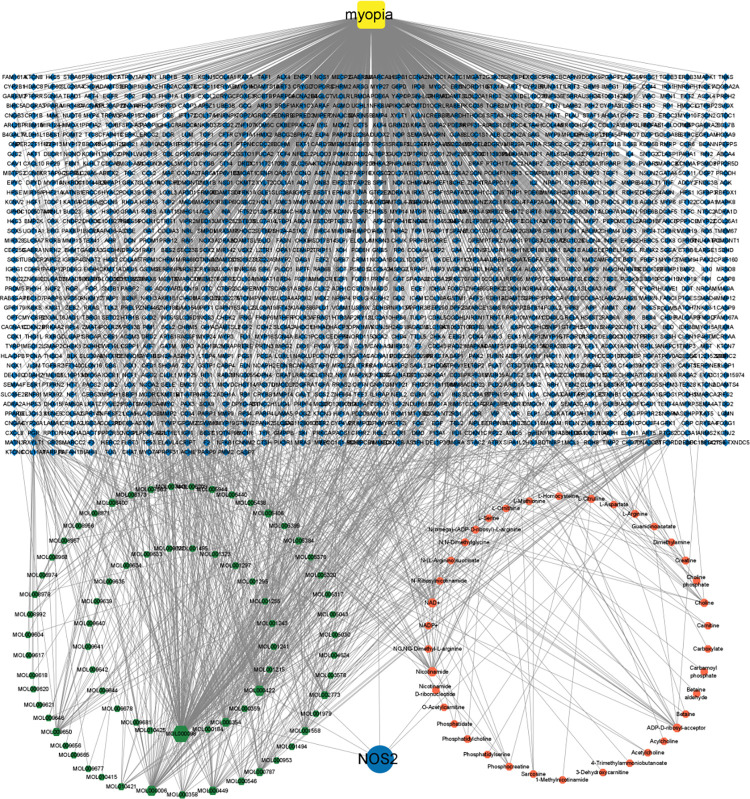
Fig 5. Construction of the compound-gene-disease-metabolites network.
Green regular hexagons represent compounds, yellow squares represent disease, and the red octagon represents metabolites. The blue diamond represents genes, including targets corresponding to potential active components, disease-related targets, and targets corresponding to differential metabolites. The blue circle represents the intersection of network pharmacology and metabolomics genes.

