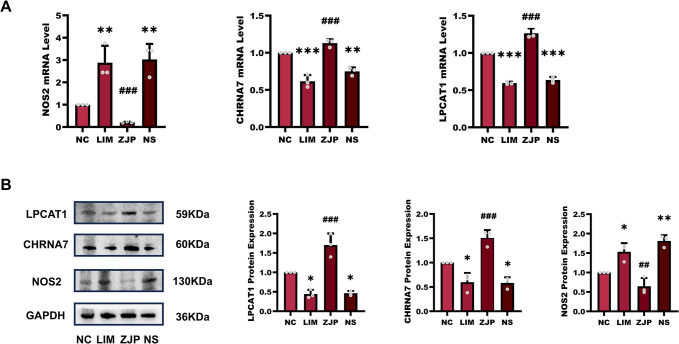
Fig 6. The expression of NOS2, LPCAT1, and CHRNA7.
A: The mRNA levels of the NOS2, LPCAT1, and CHRNA7 genes were identified by qPCR in the retinal tissues in the NC, LIM, ZJP, and NS groups. B: Western blot analysis of LPCAT1, CHRNA7, and NOS2. *P < 0.05, **P < 0.01 and ***P < 0.001 vs. the NC group, ##P < 0.05 and ###P < 0.001 vs. the LIM group.

