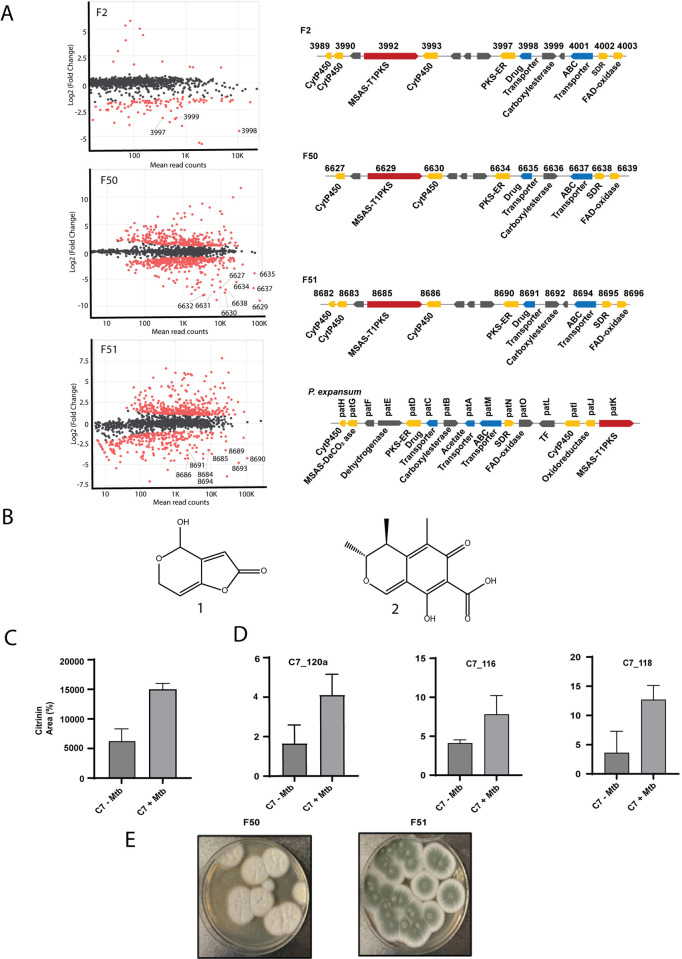
Fig 2. Four different Penicillium sp. produces patulin and citrinin upon co-cultivation with Mtb.
(A) Differential gene expression of 3 related Penicillium sp. upon co-cultivation with live Mtb. Differentially expressed genes along with read counts are shown in MA plots [49]. Up-regulated genes have a negative value in this analysis and red dots represent differentially expressed while gray/black dots are non-differentially expressed genes. The topmost up-regulated BGC for each fungi is shown to the right of each plot and points that are part of this cluster are labeled for each RNAseq experiment. For comparison, the patulin cluster for P. expansum was adapted from elsewhere (bottom right) [48]. (B) The chemical structures for patulin and citrinin. (C) RT-qPCR of about a 500 bp region of Type I PKS gene in the citrinin BCG (C7_120a) as well as 2 other genes involved in biosynthetic pathway (C7_116 and C7_118) amplified from the total RNA isolated from C7-Mtb and C7+Mtb conditions. Y-axis is expression fold relative to expression of the ITS region. (D) Area percentage of citrinin peaks in mono- and co-culture conditions obtained from the total ion chromatogram (TIC) of C7 -/+ Mtb filtrates detected at 334 nm on C-18 liquid chromatography column (Tr = 9.2 min). (E) Morphology of F50 and F51 fungal strains on PDA media. Underlying data can be found in S1 Data and S2 Data.

