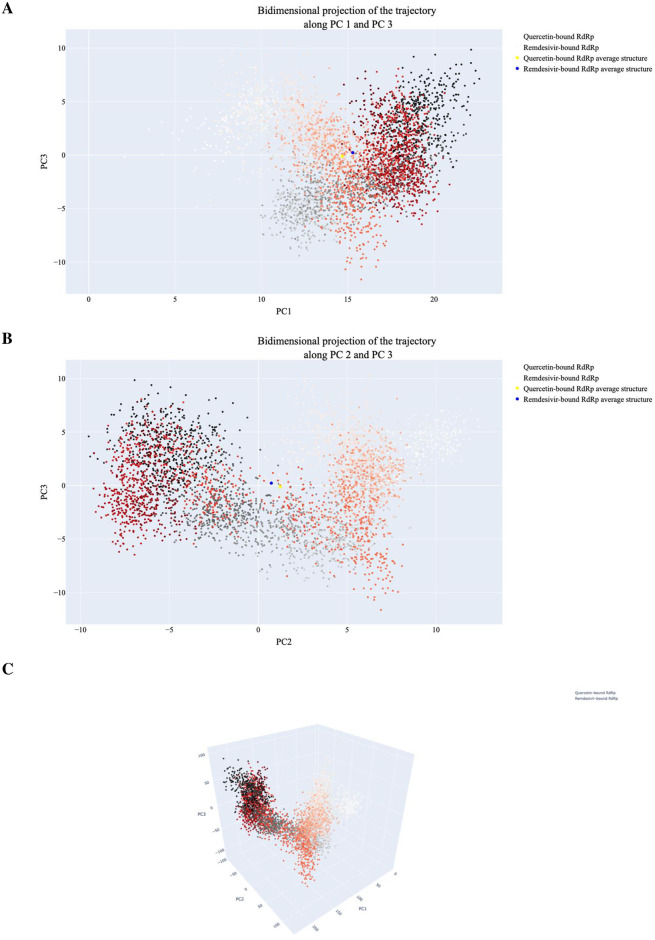
Fig 16. The projection of the RdRp-Quercetin and RdRp-Remdesivir trajectories.
A) displays the first and third eigenvectors, B) shows the second and third eigenvectors, and C) depicts the PC1-PC2-PC3. In the plots, small dots transitioning from white to black represent frames from the RdRp-Remdesivir simulation, while dots changing from white to red represent frames from the RdRp-Quercetin simulation.

