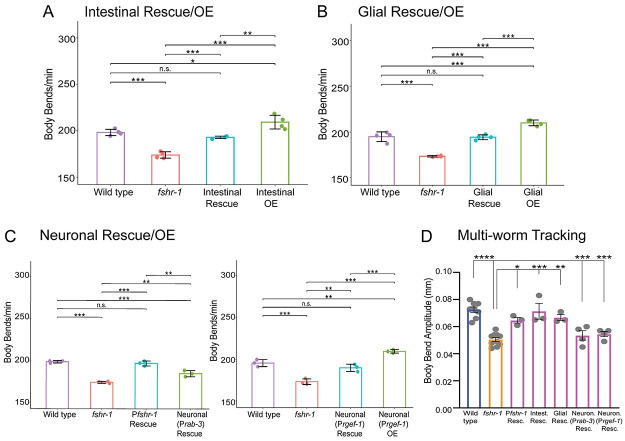
Fig 3. fshr-1 re-expression in multiple distal tissues is sufficient to restore neuromuscular signaling to fshr-1(lf) mutants.
(A-C) Swimming assays and (D) multi-worm tracking experiments were performed on wild type worms, fshr-1(ok778) mutants, and animals re-expressing fshr-1 under either an intestinal promoter (A, D; Pges-1, ibtEx35), a pan-glial promoter (B, D; Pmir-228, ibtEx51) or a pan-neuronal promoter (C, D; Prab-3, ibtEx34 or Prgef-1, ibtEx67) in either a wild type (OE, overexpression) or fshr-1 mutant background (Rescue/Resc.). (A-C) Mean body bends per minute ± S.D. obtained in swimming experiments. Each scatter point represents an independent experiment testing 30 animals per genotype. (D) Mean body bend amplitude ± S.D. obtained from multi-worm tracking experiments. Each scatter point represents an independent experiment from a population average of 20 animals. Statistical significance of the data was analyzed using a one-way ANOVA with Tukey’s multiple comparison. Colors on the bars indicate strain groups as follows: Blue = wild type, yellow = fshr-1 mutants; magenta = fshr-1 rescue strains. For all experiments, one-way ANOVA and Tukey’s post hoc tests were used to compare the means of the datasets (*p ≤ 0.05, ** p ≤ 0.01, ***p 0.001; **** p ≤ 0.0001, n.s., not significant; in (D), asterisks above the two Neuron Rescue strains indicate statistically significant differences from wild type worms, whereas asterisks above the Pfshr-1, Intestinal Rescue, and Glial Rescue bars indicate differences from fshr-1 mutants).

