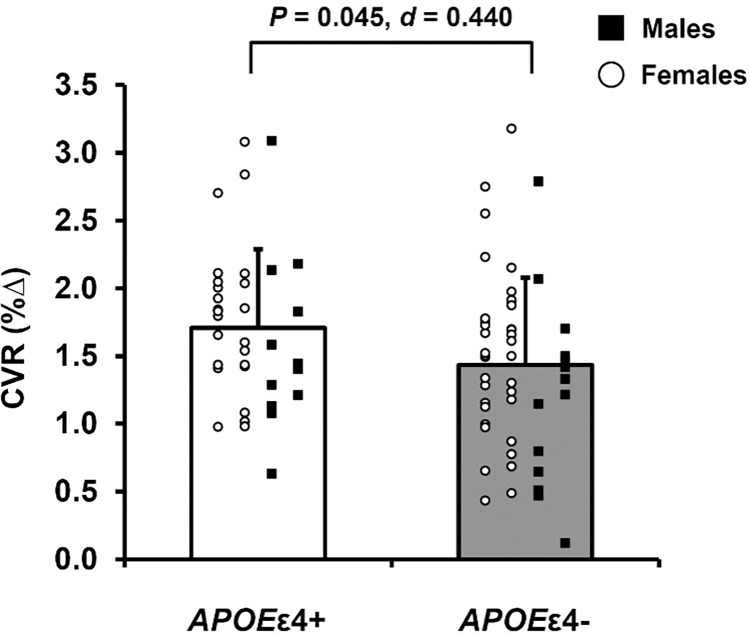
Fig 3. Cerebrovascular reactivity (CVR) to hypercapnia in apolipoprotein ε4 positive (APOEε4+) and apolipoprotein ε4 negative (APOEε4-) adults.
Data expressed as individual data and means ± standard deviation. APOEε4+ means represented by white bars and APOEε4- means represented by gray bars. Within each group, females are represented as white circles and males are represented as black squares. CVR expressed as the linear relationship between the percent change from baseline in middle cerebral artery blood velocity and the percent change in end-tidal CO2. P-value indicates result of independent samples t-test comparing CVR to hypercapnia between APOEε4+ (n = 37) and APOEε4- (n = 50) adults. Effect size calculated as Cohen’s d.

