. 2024 Dec 3;12:RP87120. doi: 10.7554/eLife.87120

Figure 5. Acute high-fat diet (HFD) induces widespread microglial metabolic response (MMR) and rapid modulation of spatial and learning memory.

(A) Primary microglial cell media was collected after the 13C-glucose tracing (containing 13C-lactate released by microglia challenged with BSA or palmitate) and incubated for 4 hr with primary neurons, the graph shows the 13C-lactate incorporation in the neurons in relative abundance, as control, primary neurons were incubated directly with 13C-glucose (n=6). (B) Graph showing the ratio MitoTracker Deep Red/ MitoTracker Green from sorted cortical microglial cells of C57Bl6/J male fed with a control diet (Control) or fed with high-fat diet for 3 days (3-day HFD) (n=5–12). (C) Graph showing the ratio MitoTracker Deep Red/ MitoTracker Green from sorted hippocampic microglial cells of C57Bl6/J male fed with a control diet (Control) or fed with 3-day HFD (n=5–12). (D) Graph showing the latency during the Barnes Test from mice fed with normal diet (Control) or 3-day HFD (n=11). The test was performed in the VAI animals facility (USA). (E) Graph showing the alternation during the T Maze Test from mice fed with normal diet (Control) or 3-day HFD (n=11). The test was performed in the VAI animals facility (USA). (F) Graph showing the distance walked during the ROTAROD test from mice fed with normal diet (Control) or 3-day HFD (n=11). (G) Graph showing the number of turn before the mice fall during the ROTAROD test from mice fed with normal diet (Control) or 3-day HFD (n=11). (H) Graph showing the latency during the ROTAROD test from mice fed with normal diet (Control) or 3-day HFD (n=11). (I) Microglial staining with Iba1 (green) in the hippocampus slices from mice fed with 3 days HFD or mice depleted from their microglial cells with 1 week control diet complexed with PLX-5662 prior the 3 days HFD (PLX-5662) (n=5). (J) Graph showing the latency during the Barnes Test from mice fed with normal diet (Control) (n=6), mice fed with 3-day HFD (n=6), mice depleted from their microglial cells with 1 week control diet complexed with PLX-5662 (PLX-Control) (n=8) or mice depleted from their microglial cells with 1 week control diet complexed with PLX-5662 prior the 3 days HFD (PLX-3-day HFD) (n=8). (K) Graph showing the latency during the Barnes Test from Drp1MGWT or Drp1MGKO mice fed with normal diet (Control diet) or with 3-day HFD (n=11). Data are presented as mean ± SEM. *p<0.05, **p<0.01, ***p<0.001 as determined by two-tailed Student’s t-test and two-way ANOVA followed by Bonferroni post hoc test.

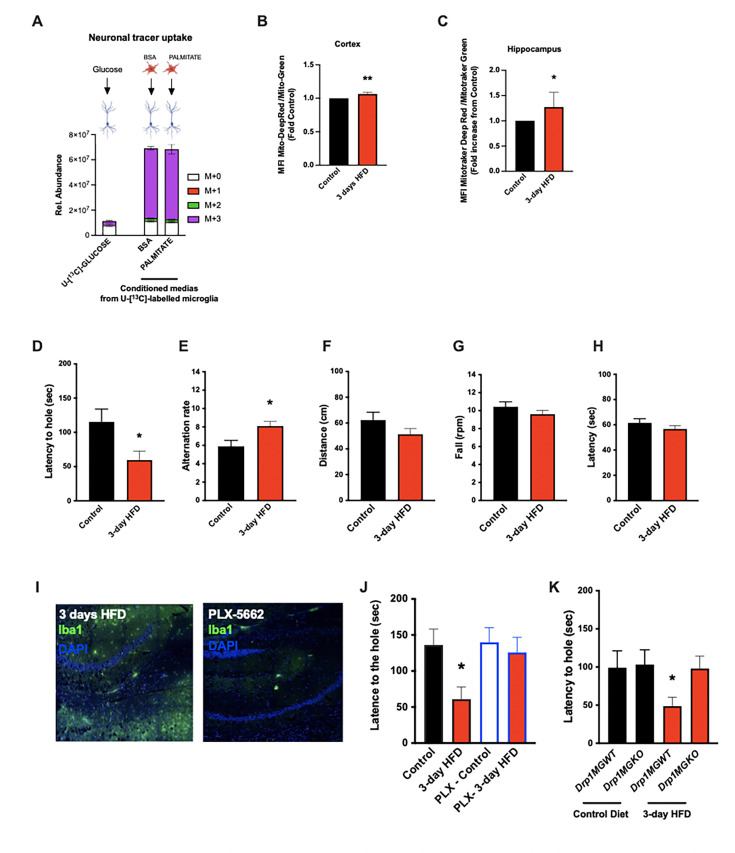
Figure 5.

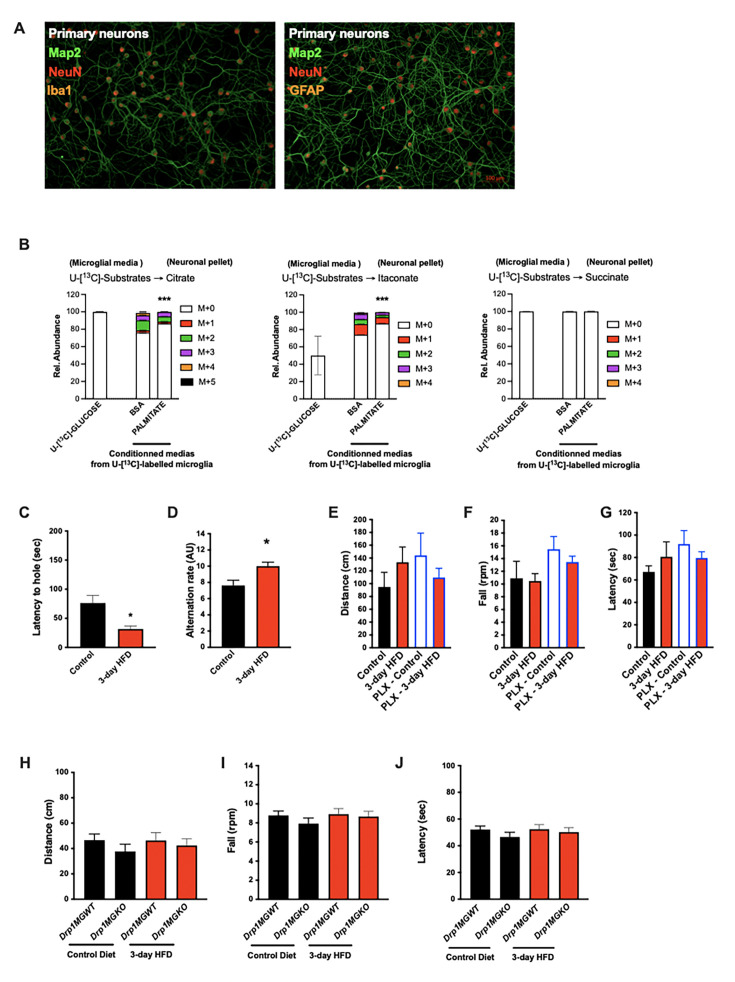
Figure 5—figure supplement 1. Acute high-fat diet (HFD) induces widespread microglial metabolic response (MMR) and rapid modulation of spatial and learning memory (supplement).

Figure 5—figure supplement 1.

(A) Map2, NeuN, Iba1 and Map2, NeuN, GFAP immunostainings on primary neurons. (B) Primary microglial cell media was collected after the 13C-glucose tracing (containing 13C- metabolites released by microglia challenged with BSA or palmitate) and incubated for 4 hr with primary neurons, the graph shows the 13C-citrate, 13C-itaconate, and 13C-succinate incorporation in the neurons in relative abundance (n=6). (C) Graph showing the latency during the Barnes Test from mice fed with normal diet (Control), or 3 days HFD (3-day HFD) (n=11). The test was performed in the MPI animals facility (Germany). (D) Graph showing the alternation during the T Maze Test from mice fed with normal diet (Control), or 3-day HFD (n=11). The test was performed in the MPI animals facility (Germany). (E) Graph showing the distance walked during the ROTAROD test from mice fed with normal diet (Control) (n=4), mice fed with 3-day HFD (n=6), mice depleted from their microglial cells with 1 week control diet complexed with PLX-5662 (PLX-Control) (n=8) or mice depleted from their microglial cells with 1 week control diet complexed with PLX-5662 prior the 3 days HFD (PLX-3-day HFD) (n=12). (F) Graph showing the number of turns before the mice fall during the ROTAROD test from mice fed with normal diet (Control) (n=4), mice fed with 3-day HFD (n=6), mice depleted from their microglial cells with 1 week control diet complexed with PLX-5662 (PLX-Control) (n=8) or mice depleted from their microglial cells with 1 week control diet complexed with PLX-3-day HFD (n=12). (G) Graph showing the latency during the ROTAROD test from mice fed with normal diet (Control) (n=4), mice fed with3-day HFD (n=6), mice depleted from their microglial cells with 1 week control diet complexed with PLX-5662 (PLX-Control) (n=8) or mice depleted from their microglial cells with 1 week control diet complexed with PLX-3-day HFD (n=12). (H) Graph showing the distance walked during the ROTAROD test from Drp1MGWT or Drp1MGKO mice fed with normal diet (Control diet), or 3-day HFD (n=11). (I) Graph showing the number of turns before the mice fall during the ROTAROD test from Drp1MGWT or Drp1MGKO mice fed with normal diet (Control diet), or 3-day HFD (n=11). (J) Graph showing the latency during the ROTAROD test from Drp1MGWT or Drp1MGKO mice fed with normal diet (Control diet), or 3-day HFD (n=11). Data are presented as mean ± SEM. *p<0.05, **p<0.01, ***p<0.001 as determined by two-tailed Student’s t-test and two-way ANOVA followed by Bonferroni post hoc.
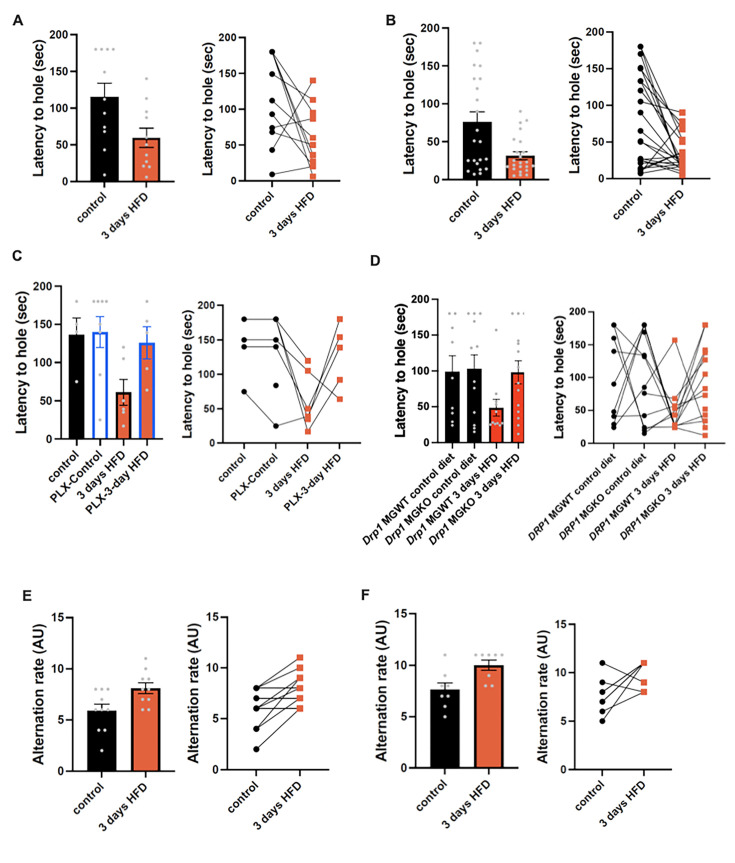
Figure 5—figure supplement 2. Acute HFD induces widespread microglial metabolic response (MMR) and rapid modulation of spatialand learning memory (supplement — individual replicate data).

Figure 5—figure supplement 2.

(A) Graphs showing the latency during the Barnes Test from Figure 5D with samples distribution and by using the paired comparison method. (B) Graphs showing the latency during the Barnes Test from Figure 5—figure supplement 1C with samples distribution and by using the paired comparison method. (C) Graphs showing the latency during the Barnes Test from Figure 5J with samples distribution and by using the paired comparison method. (D) Graphs showing the latency during the Barnes Test from Figure 5K with samples distribution and by using the paired comparison method. (E) Graphs showing the alternation during the T Maze Test from Figure 5E with samples distribution and by using the paired comparison method. (F) Graphs showing the alternation during the T Maze Test from Figure 5—figure supplement 1D with samples distribution and by using the paired comparison method.
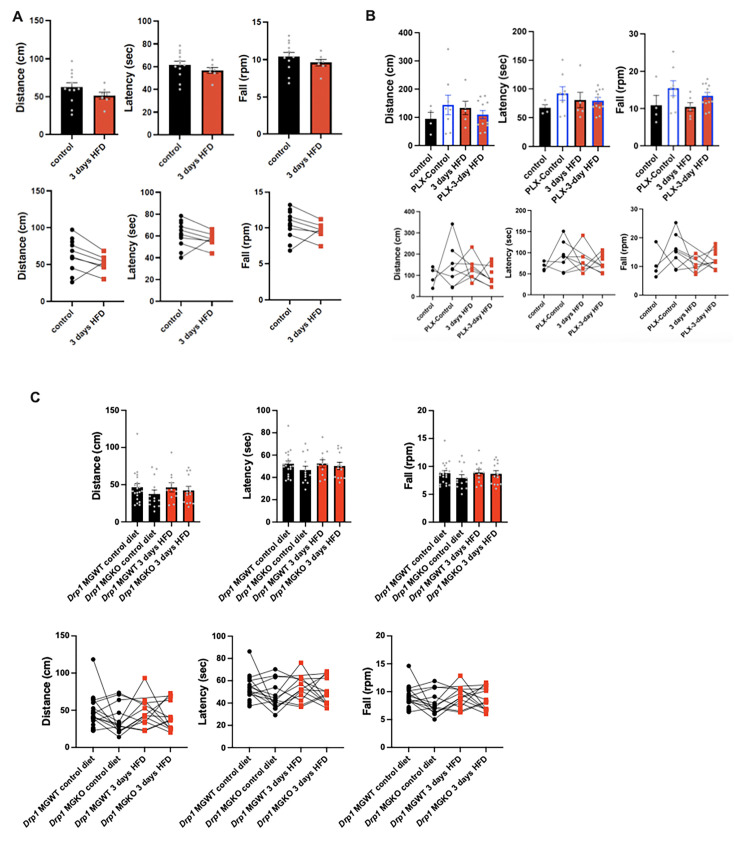
Figure 5—figure supplement 3. Acute high-fat diet (HFD) doesn't affect the motor coordination.

Figure 5—figure supplement 3.

(A) Graphs showing the ROTAROD results (distance, latency, fall) from Figure 5F–H with samples distribution and by using the paired comparison method. (B) Graphs showing the ROTAROD results (distance, latency, fall) from Figure 5—figure supplement 1E–G with samples distribution and by using the paired comparison method. (C) Graphs showing the ROTAROD results (distance, latency, fall) from Figure 5—figure supplement 1H–J with samples distribution and by using the paired comparison method.