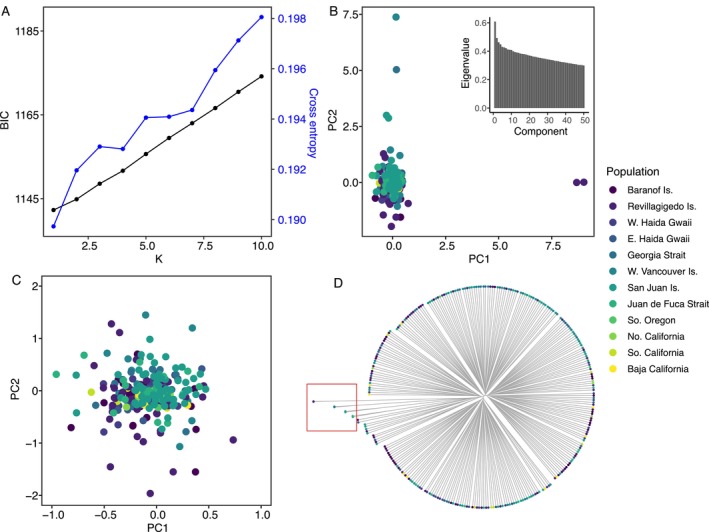
FIGURE 2.

(A) Results of snmf and find. clusters analyses, showing cross entropy and Bayesian information criterion (BIC) in relation to k ranging from 1 to 10. (B) Principal components analysis of all samples with inset scree plot showing component loadings. Samples are colored according to the population color scheme in right‐hand legend. (C) Zoomed‐in view of (B) excluding outliers determined to be close relatives. (D) Dendrogram of the genomic relatedness distance matrix, showing highlighted outliers likely to be close relatives. Most of these individuals also appear as outliers in (B).
