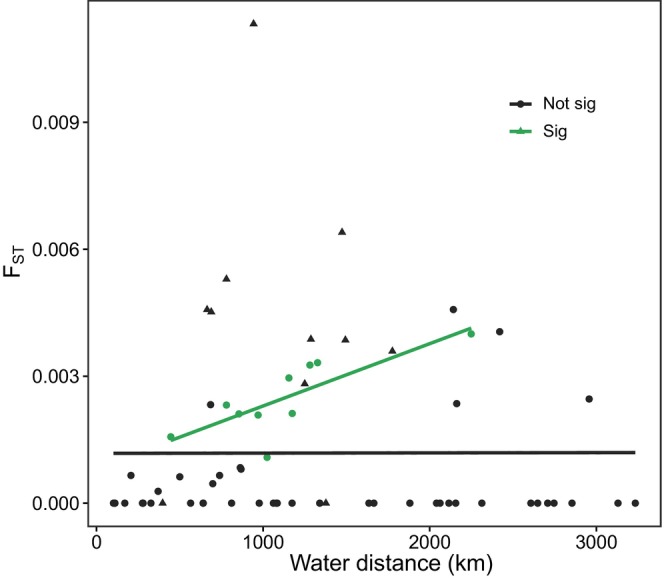
FIGURE 4.

Analysis of isolation by distance (IBD), with pairwise lineal water distance between sampling locations on the x‐axis and pairwise F ST values on the y‐axis. The all‐inclusive analysis is shown in black (Mantel test, p = 0.41), while the analysis including only significant pairwise F ST values is shown in green (Pearson test, p = 0.007). Outlier values from pairwise comparisons including Southern Oregon are shown as black triangles.
