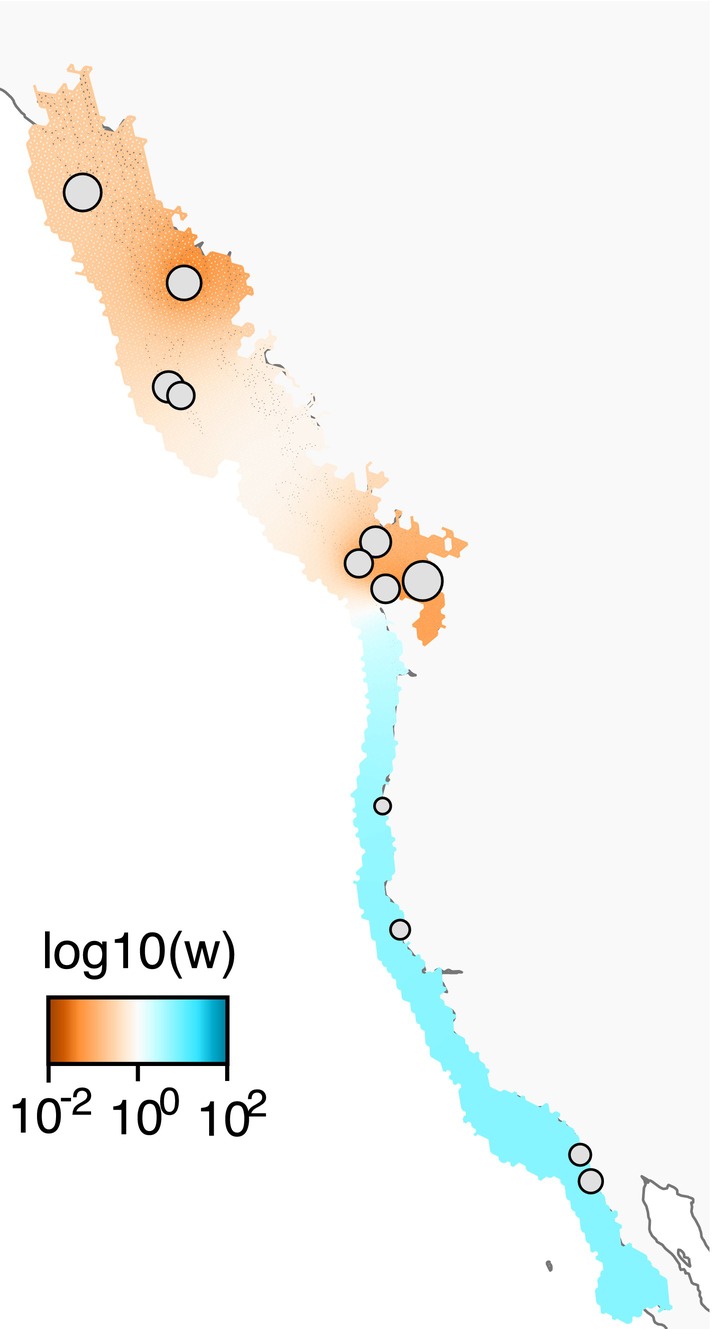
FIGURE 5.

Results of feems (fast estimation of effective migration surfaces) analysis along the range of H. kamtschatkana, showing estimated surfaces for log of effective migrants per generation. Gray circles represent sampling locations, with the size of the circle relative to the sample size.
