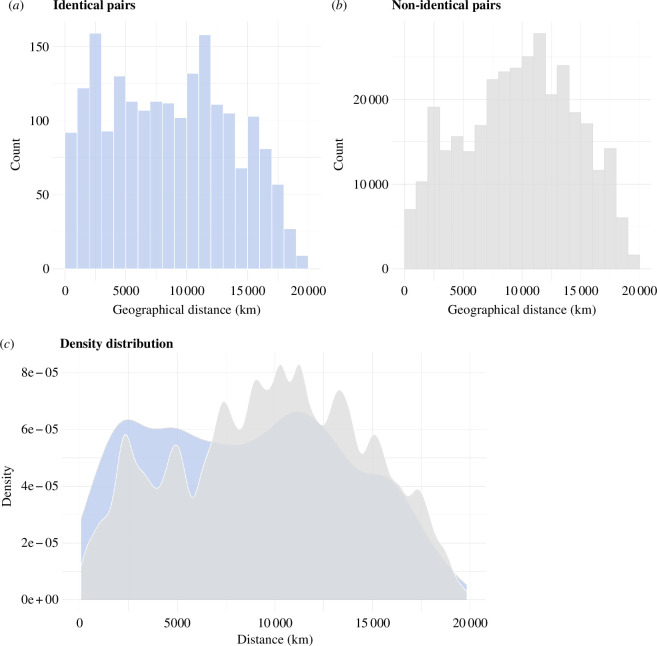
Figure 4.
Analysis of the geographical distribution of structurally identical (a) and non-identical (b) string figure pairs. Histogram (a) (blue) depicts the geographical distribution of structurally identical string figures. Histogram (b) (grey) depicts the geographical distribution of non-identical (i.e. all other) pairs of string figures. Plot (c) overlays the smoothed density distributions of histograms (a,b) allowing the comparison of the geographical distribution of identical and non-identical string figures. Within-culture comparisons are excluded from this figure.

