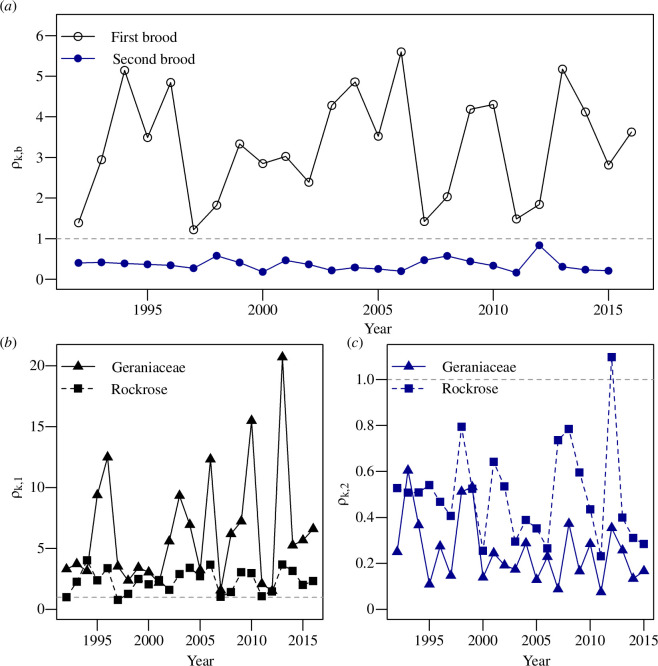
Figure 2.
(a) Brown argus first and second brood productivities (ρ) from the all-sites model, plotted against year. (b) and (c) First and second brood productivities, respectively, at Geraniaceae and Helianthemum sites, from models PGfinal (Geraniaceae sites) and PHfinal (Helianthemum sites). ρ > 1 (dashed grey line) indicates population growth, ρ < 1 indicates decline.

