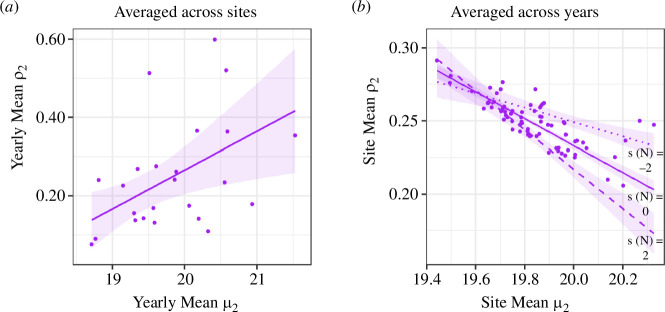
Figure 4.
Relationships (with 95% confidence intervals) between second brood phenology (mean flight date, µ2, in weeks since 1 April), northing (standardized, s(N)) and second brood productivity (mean overwinter population growth, ρ2) at Geraniaceae sites. Estimates derived from models (a) G-ρ2-tm-final and (b) G-ρ2-sp-final (table 2). In (a) point estimates represent the mean across years at individual sites; while point estimates in (b) represent the average across sites in each of 24 years. NB. Axis limits differ between plots.

