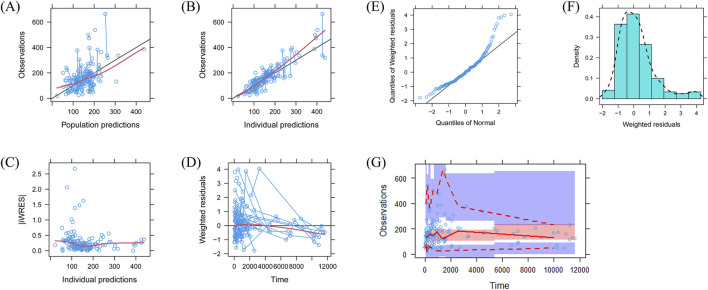
FIGURE 1.
Model evaluations: (A) observations vs. population predictions; (B) observations vs. individual predictions; (C) absolute value of the weighted residuals of the individuals (│iWRES│) vs. individual predictions; (D) weighted residuals vs. time; (E) quantiles of weighted residuals vs. normal quantiles; (F) density vs. weighted residuals; (G) visual predictive check of the model.

