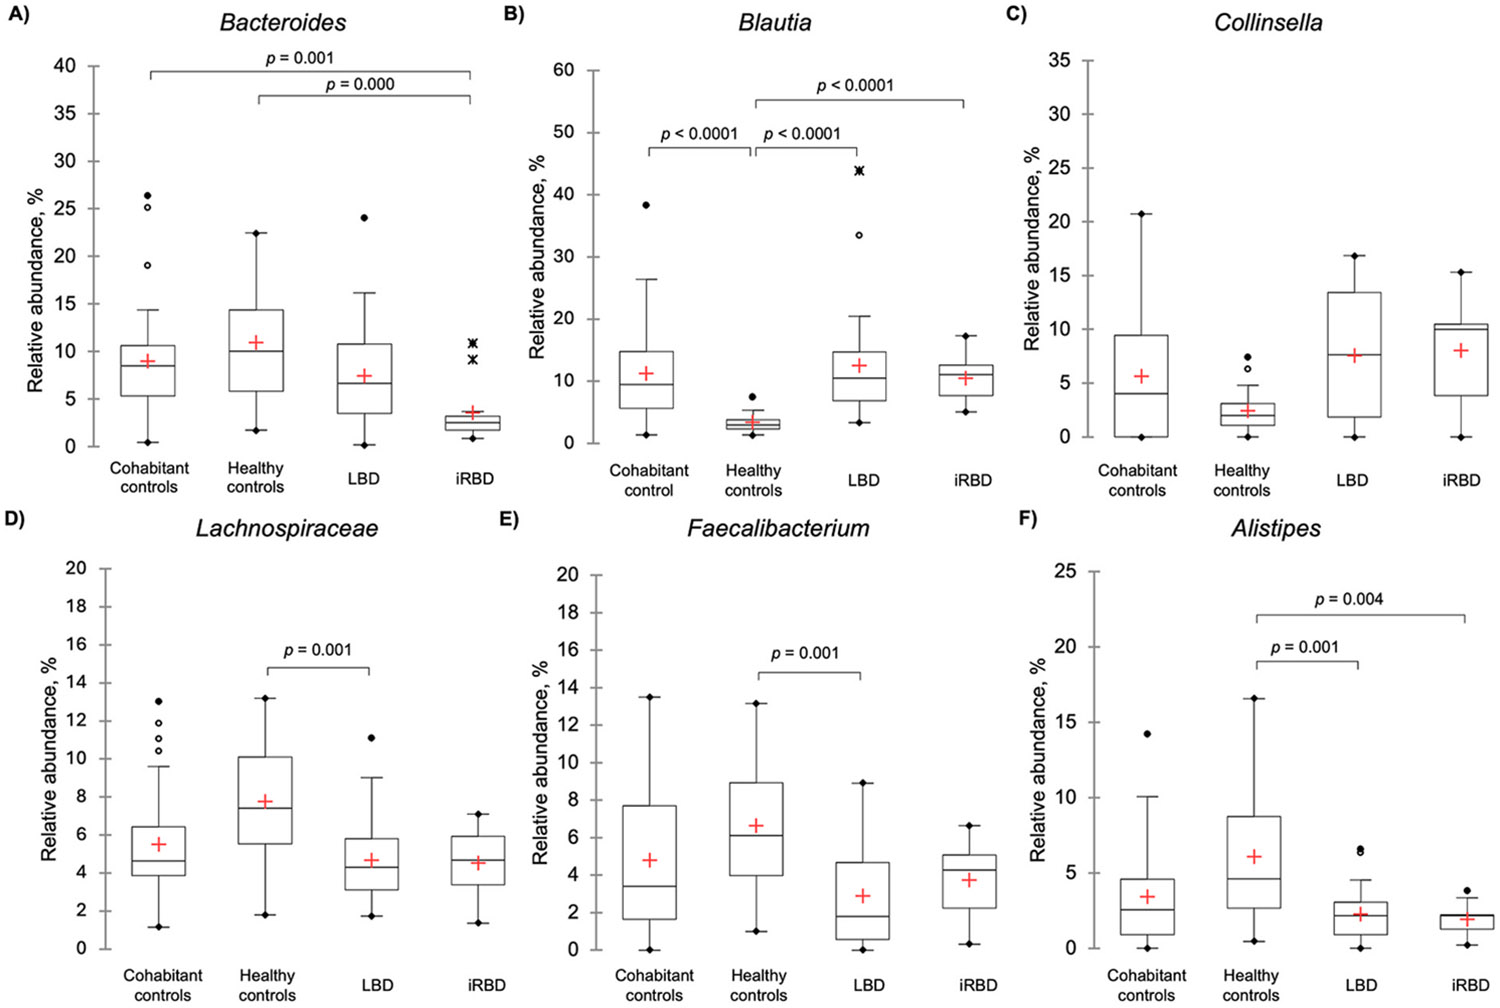
Fig. 1.

Comparisons of relative abundance distributions of taxa between Lewy body disease, isolated REM sleep behavior disorder, cohabitant controls and healthy controls
Legend - Box-plots of relative abundance distributions of taxa found to be significantly different between study groups along with Collinsella which lost significance after Bonferroni correction. The red cross represents the mean. The solid black lines in ascending order represent the minimum, quartile 1, median, quartile 3, and maximum. Data points more than 1.5 times the IQR away from the first or third quartiles are considered outliers and are marked by hollow, solid, and X points.
