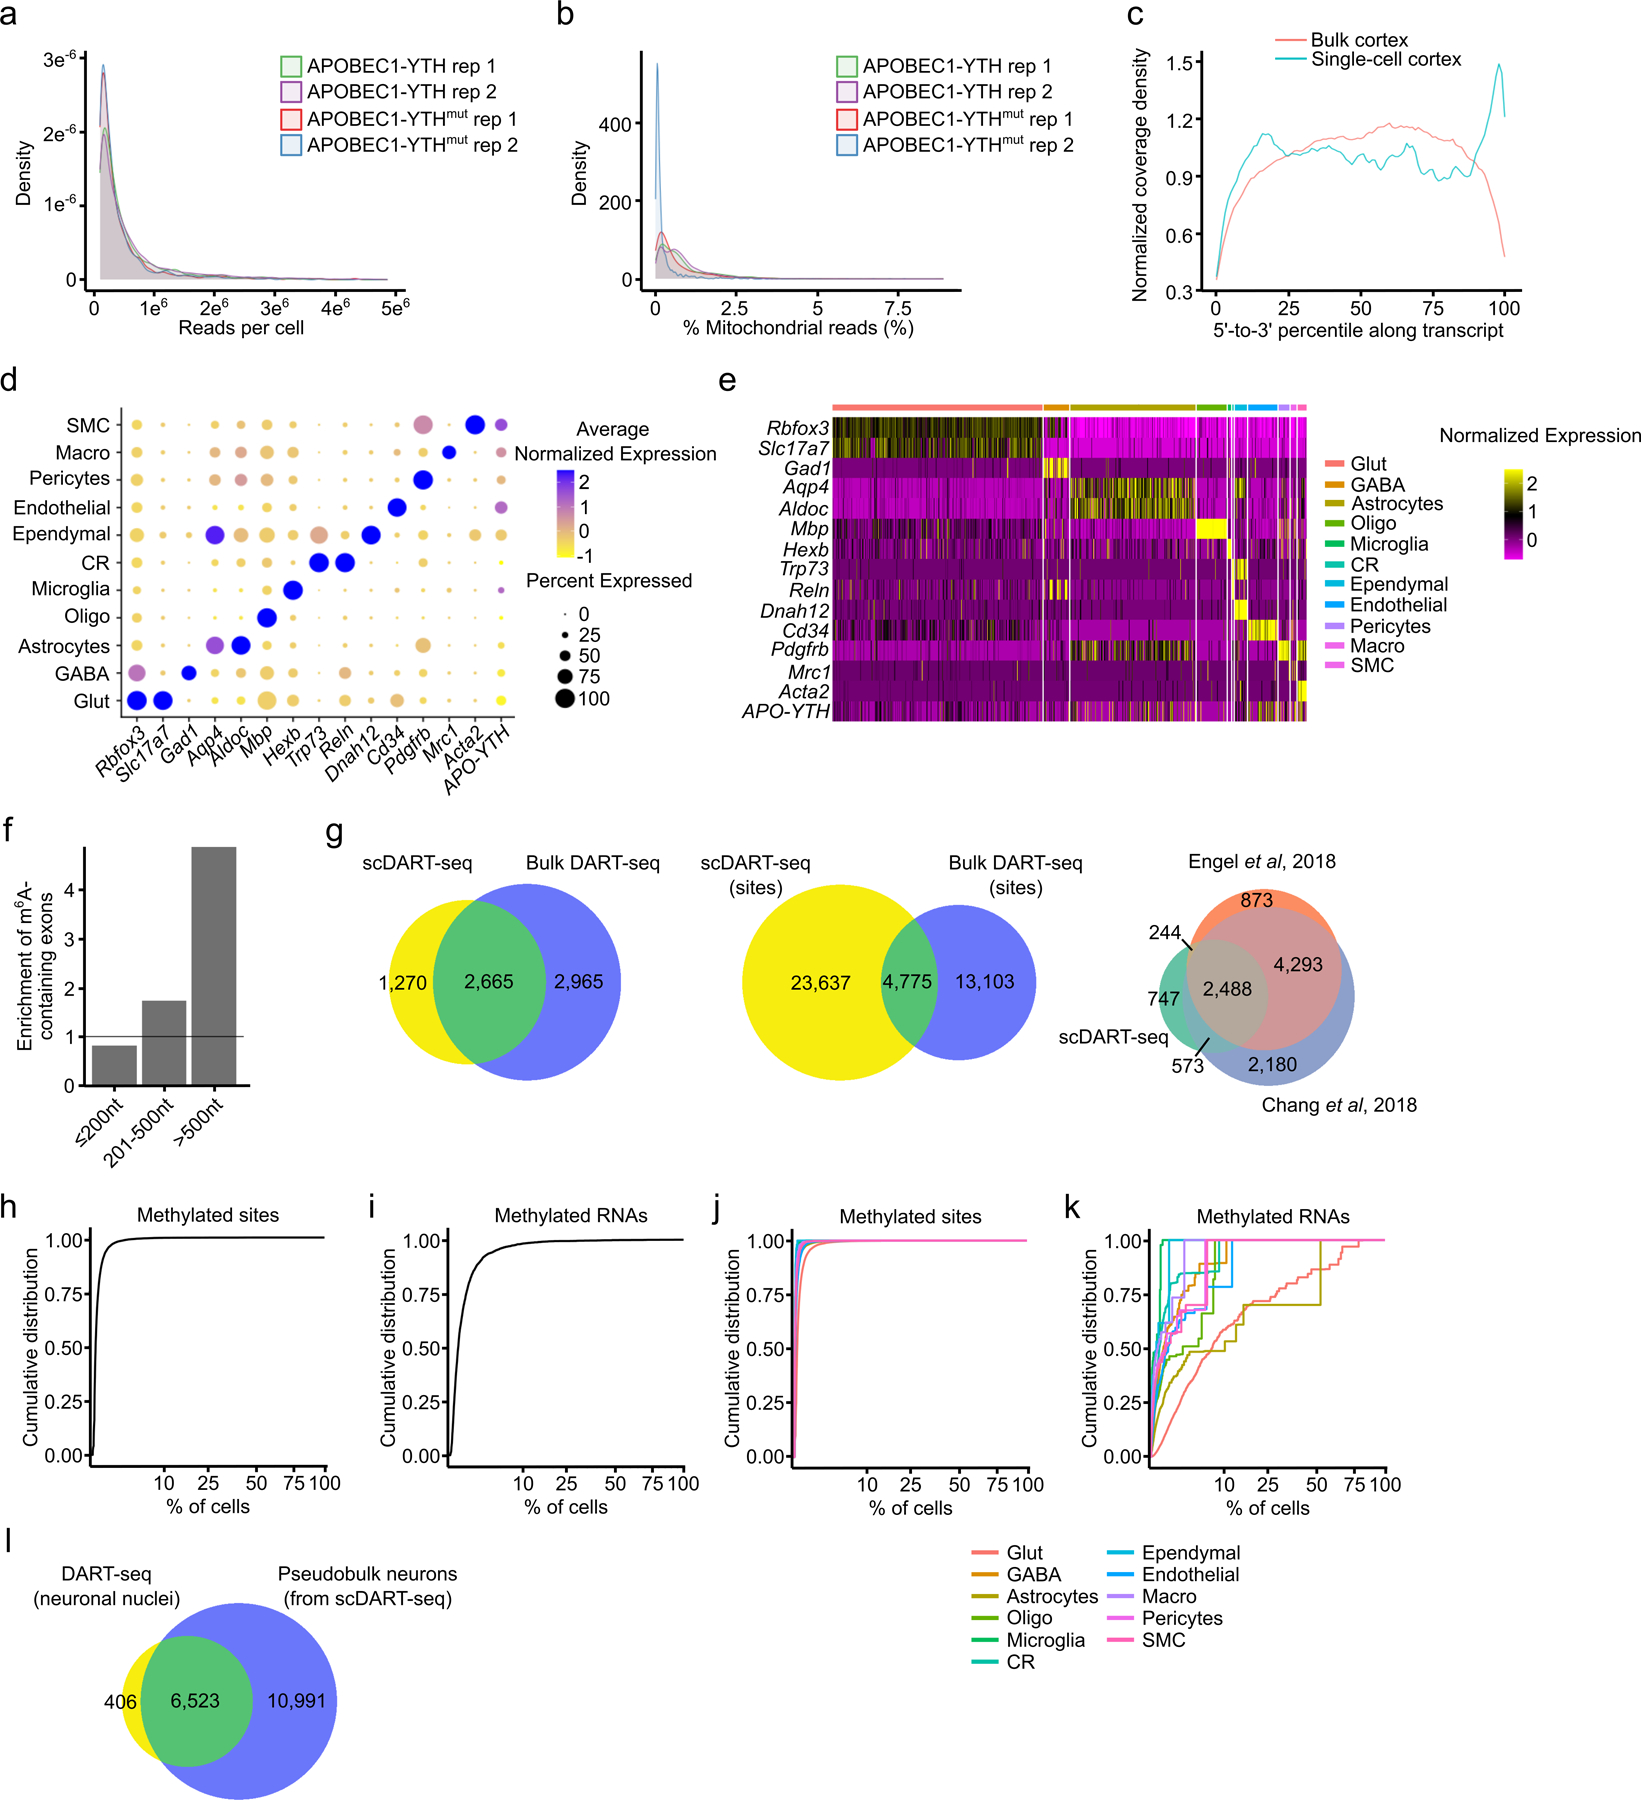
Extended Data Fig. 5 – Characteristics of gene expression and RNA methylation in the adult mouse cortex.

a, Density plot showing the number of total RNA-seq reads per cell from replicate mice with the indicated genotype. b, Density plot showing the percentage of reads mapping to mitochondrial mRNAs in replicate mice with the indicated genotype. The vast majority of cells in all replicates show very low mitochondrial representation (< 2%). c, Metagene analysis of RNA-seq reads from bulk and scDART-seq data using split-pool barcoding. Although there is an enrichment of reads at the 3’ end of transcripts using split-pool barcoding scRNA-seq, good coverage is obtained across transcript length. d, Marker gene expression across individual cell types in the cortex. Dot color indicates average normalized expression in the indicated cell type. Dot size indicates percentage of cells that express the marker gene. e, Heatmap showing marker gene expression within different cell types in the cortex. f, Barplot showing the enrichment of m6A sites in long internal exons from scDART-seq analysis of the mouse cortex. Enrichment indicates the number of methylated internal exons relative to the total number of internal exons within each group. g, Overlap of methylated RNAs identified by scDART-seq and bulk DART-seq in the mouse cortex (left). Overlap of methylated sites identified in the cortex using scDART-seq and bulk DART-seq (middle). Overlap of methylated RNAs identified by scDART-seq and MeRIP-seq in the mouse cortex (right). h, Cumulative distribution plot as in (d), but showing each cell type separately. i, Cumulative distribution plot of all m6A sites identified in the mouse cortex and the percentage of cells in which each site is methylated. Only cells expressing the parent RNA were considered (n = 27,400). j, Cumulative distribution plot of methylated RNAs identified in the mouse cortex and the percentage of cells in which the RNA is methylated. Cells that do not express the RNA were excluded from the analysis (n = 3,991). k, Cumulative distribution plot as in (c), but showing each cell type separately. l, Overlap of methylated RNAs identified by performing nuclear DART-seq on mouse cortical neurons and those identified in neurons from the scDART-seq dataset. Glut = Glutamatergic Neuron; GABA = GABAergic Neuron; Oligo = Oligodendrocyte; Micro = Microglia; CR = Cajal-Retzius Cell; Macro = Peripheral Macrophage; SMC = Smooth Muscle Cell.
