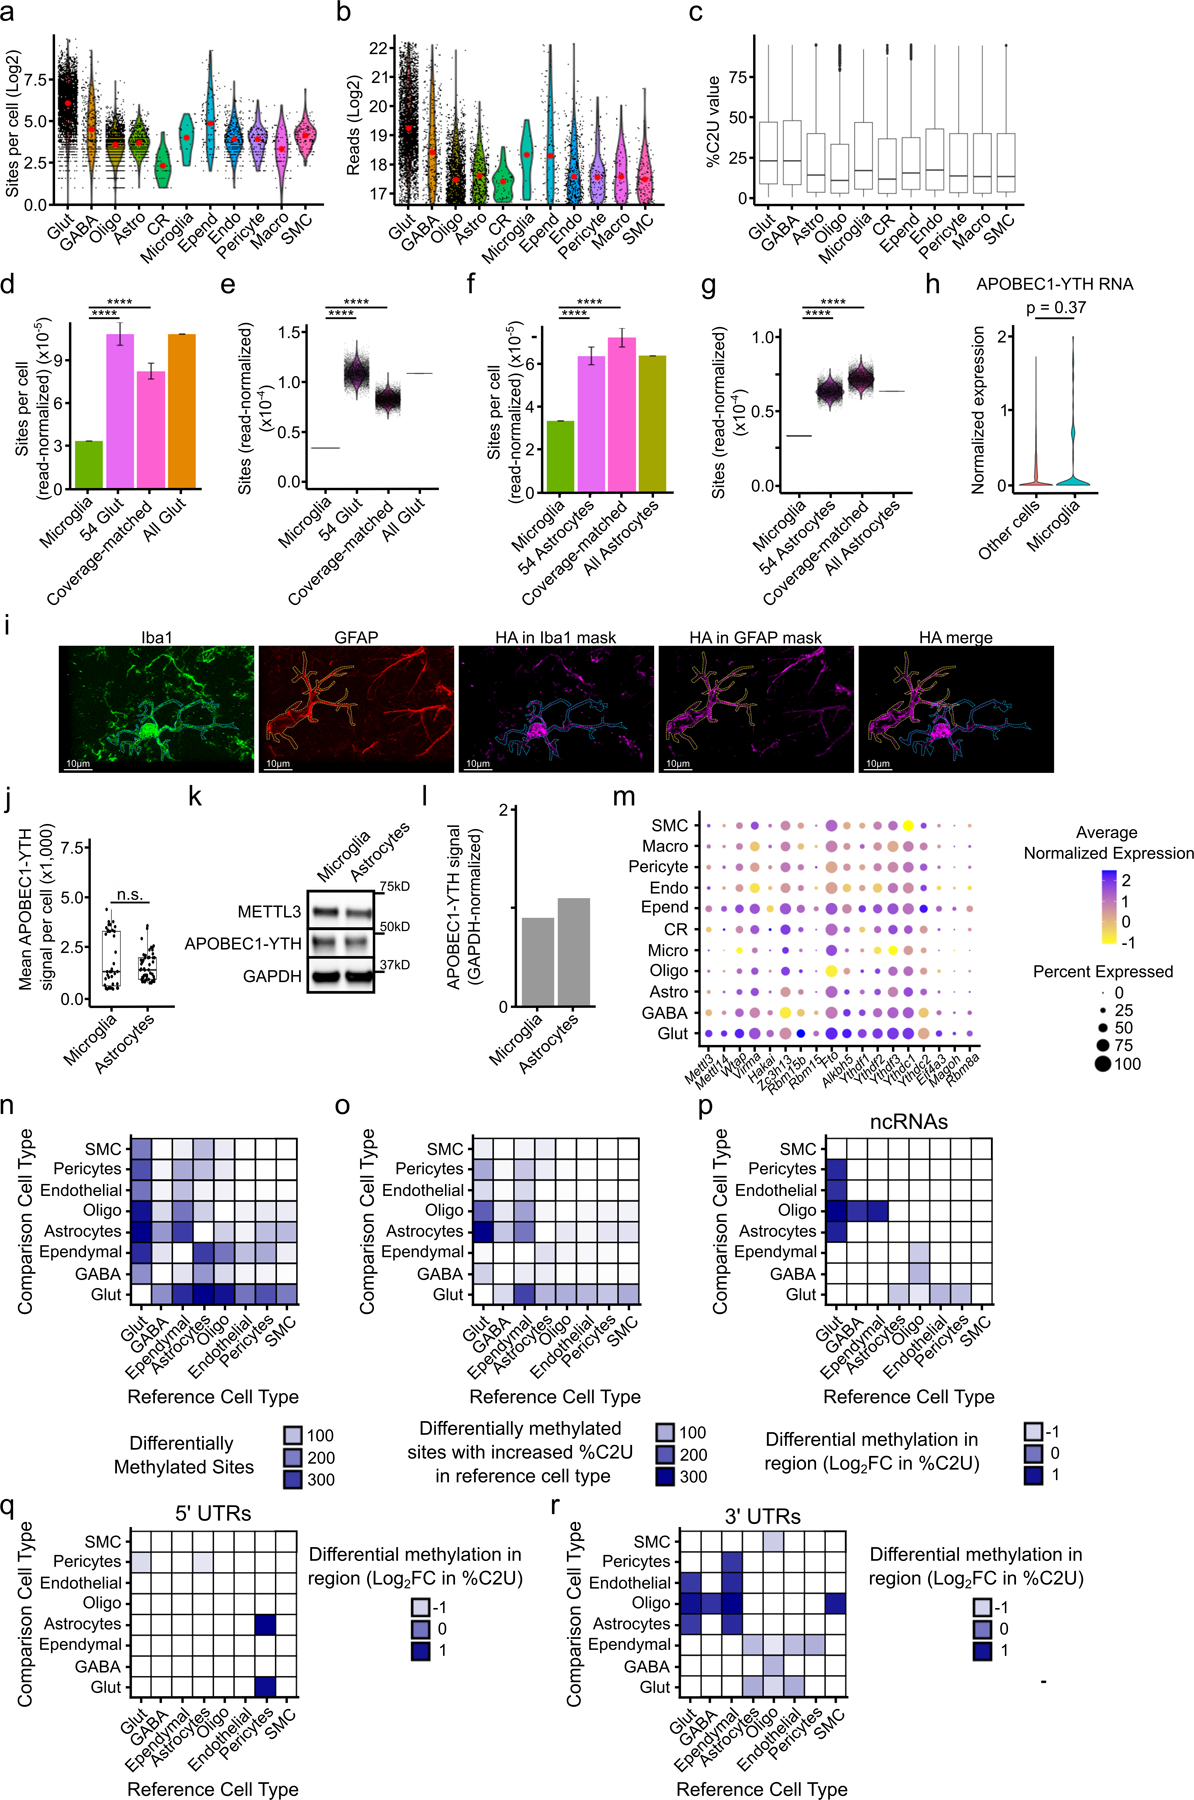
Extended Data Fig. 6 – Analysis of m6A in microglia and other cortical cell types.

a, Total number of m6A sites per cell within the indicated cell types, not normalized to read counts. Red dot indicates the mean. b, Total number of reads detected per cell within each cell type. Red dot indicates the mean. c, All single-cell %C2U values for m6A sites identified within each cell type (Glut n = 280,790; GABA n = 11,214; Astro n = 19,370; Oligo n = 4,769; Micro n = 133; CR n = 211; Ependy n = 6,775; Endo n = 6,314; Peri n = 1,949; Macro n = 935; SMC n = 2,232). Boxes show 25–75th percentiles and the median, with whiskers for the highest and lowest values and outliers shown. d, Number of m6A sites per cell, normalized to read coverage, identified in microglia (n = 54 cells) and glutamatergic neurons (“All Glut”; n = 3,842 cells). 54 Glut represents 10,000 iterations of 54 randomly selected glutamatergic neurons within the scDART-seq dataset. Coverage-matched represents 10,000 iterations of 54 randomly selected glutamatergic neurons with similar reads per cell as microglia. Error bars represent standard deviation. Significance was determined using a two-sided Wilcoxon rank-sum test. p-value for all shown comparisons < 2.2e−16. **** = p < 0.0001. e, Violin plot of data in (d). Each dot represents the average number of read-normalized sites per cell obtained from 54 random glutamatergic neurons sampled. Significance was determined using a two-sided Wilcoxon rank-sum test. p-value for all shown comparisons < 2.2e−16. **** = p < 0.0001. f, Number of m6A sites per cell, normalized to read coverage, identified in microglia (n = 54 cells) and astrocytes (“All Astrocytes”; n = 1,952 cells). 54 Astrocytes represents 10,000 iterations of 54 random astrocytes within the scDART-seq dataset. Coverage-matched represents 10,000 iterations of 54 random astrocytes with similar reads per cell as microglia. Error bars represent standard deviation. Significance was determined using a two-sided Wilcoxon rank-sum test. p-value for all shown comparisons < 2.2e−16. **** = p < 0.0001. g, Violin plot of data in (f). Each dot represents the average read-normalized sites per cell obtained from each iteration of 54 random astrocytes sampled. h, Normalized expression of APOBEC1-YTH in microglia compared to all other cell types. Significance was determined using FindMarkers in Seurat (two-sided Wilcoxon rank-sum test was used, with Bonferroni p-value adjustment). i, Representative images of n = 2 biological replicates, comparing APOBEC1-YTH expression (magenta) in a microglial cell (marked by Iba1 staining, green) and an astrocyte (marked by GFAP staining, red). Merge shows the neighboring microglia and astrocyte, with external APOBEC1-YTH signal removed for clarity. j, Quantification of APOBEC1-YTH immunofluorescence intensity in microglia (n = 43 cells from 2 distinct animals) and astrocytes (n = 49 cells from 2 distinct animals) in DART mice. Significance was determined using a two-sided Wilcoxon rank-sum test. n.s. = not statistically significant. Boxes show 25–75th percentiles and the median, with whiskers for the highest and lowest values and outliers shown. k, Western blot showing APOBEC1-YTH and METTL3 expression within cortical microglia and astrocytes isolated by FACS. n = 1 biological replicate. GAPDH was run concurrently on a separate identical blot. l, Quantification of (k) showing the GAPDH-normalized expression of APOBEC1-YTH. m, Dot plot showing expression level and percentage of cells with expression of mRNAs for m6A methyltransferase components, m6A readers, m6A erasers, and EJC proteins. n, Heatmap showing the total number of differentially methylated sites identified between each pair of cell types in the cortex. Heatmap is colored by the number of differentially methylated sites identified in the reference cell type relative to the comparison cell type. o, Heatmap showing the number of differentially methylated sites with increased average %C2U in the reference cell type relative to the comparison cell type, colored by the number of differentially methylated sites. p, Heatmap showing the average log2 fold-change in %C2U for all sites found in non-coding RNAs (ncRNAs) within each region in the reference cell type relative to the comparison cell type. q, Heatmap showing the average log2 fold-change in %C2U for all sites found in 5’ UTRs within each region in the reference cell type relative to the comparison cell type. r, Heatmap showing the average log2 fold-change in %C2U for all sites found in 3’ UTRs in the reference cell type relative to the comparison cell type. There are no pairs of cell types with significant differential methylation within coding sequences.
