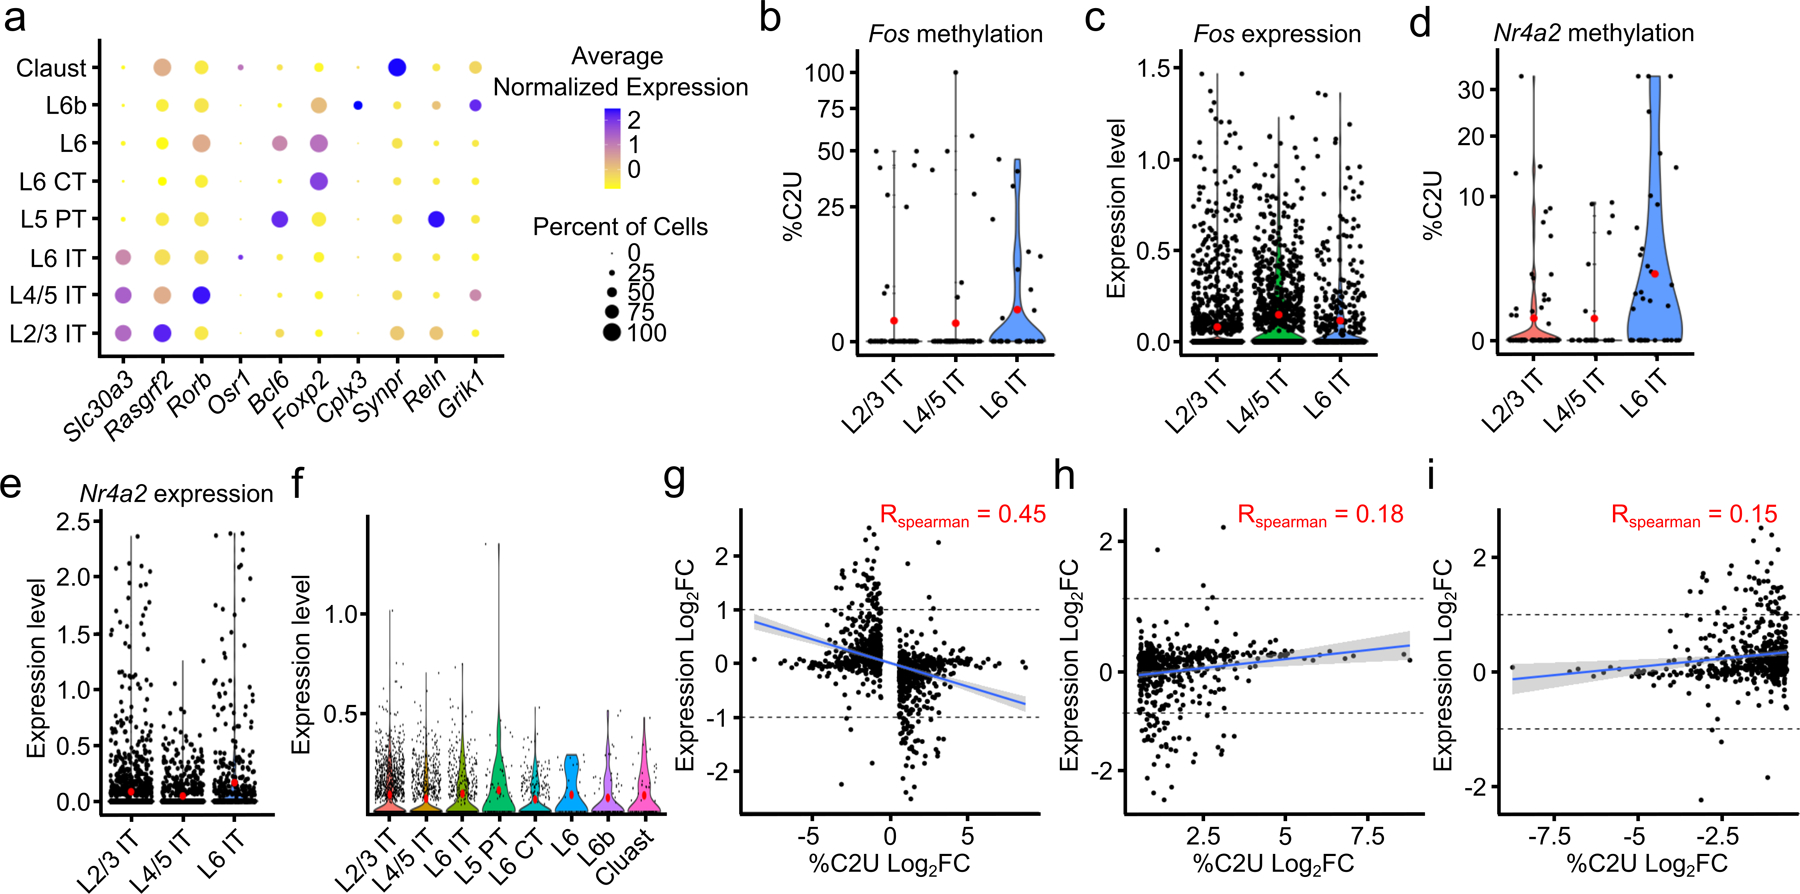
Extended Data Fig. 8 – Differential methylation in neuronal subtypes.

a, Expression of marker genes within each glutamatergic neuron subtype. Dot color indicates average expression level of the indicated mRNA. Dot size indicates percentage of cells in which the mRNA is expressed. b, Average %C2U value of all sites in the Fos mRNA in IT glutamatergic neurons from different cortical layers. Red dots indicate mean values. n = 320. c, Normalized gene expression of the Fos mRNA in IT glutamatergic neurons from different cortical layers. n = 2,930. d, Average %C2U value of all sites in the Nr4a2 mRNA in IT glutamatergic neurons from different cortical layers. Red dots indicate mean values. n = 360. e, Normalized gene expression of the Nr4a2 mRNA in IT glutamatergic neurons from different cortical layers. Red dots indicate mean values. n = 2,930. f, APOBEC1-YTH RNA expression within each neuronal subtype. Red dots indicate mean values. n = 3,823. g, Correlation of changes in %C2U and gene expression of DM-RNAs between neuronal subtypes. Spearman correlation coefficient is shown, blue indicates linear regression, gray band represents 95% confidence interval. p < 2.2 x 10⁻¹⁶. n = 1,034. h, As in (g), but only showing DM-RNAs with increased %C2U values in each neuronal subtype. p = 2.65 x 10⁻⁵. n = 512. Spearman correlation coefficient is shown, blue indicates linear regression, gray band represents 95% confidence interval. i, As in (g), but only showing DM-RNAs with decreased %C2U values in each neuronal subtype. p = 3.9 x 10⁻⁴. n = 522. Spearman correlation coefficient is shown, blue indicates linear regression, gray band represents 95% confidence interval. L2/3 = Layer 2/3; L4/5 = Layer 4/5; L6 = Layer 6; IT = Intratelencephalic; PT = Pyrimidal tract; CT = Corticothalamic tract; Claust = Claustrum.
