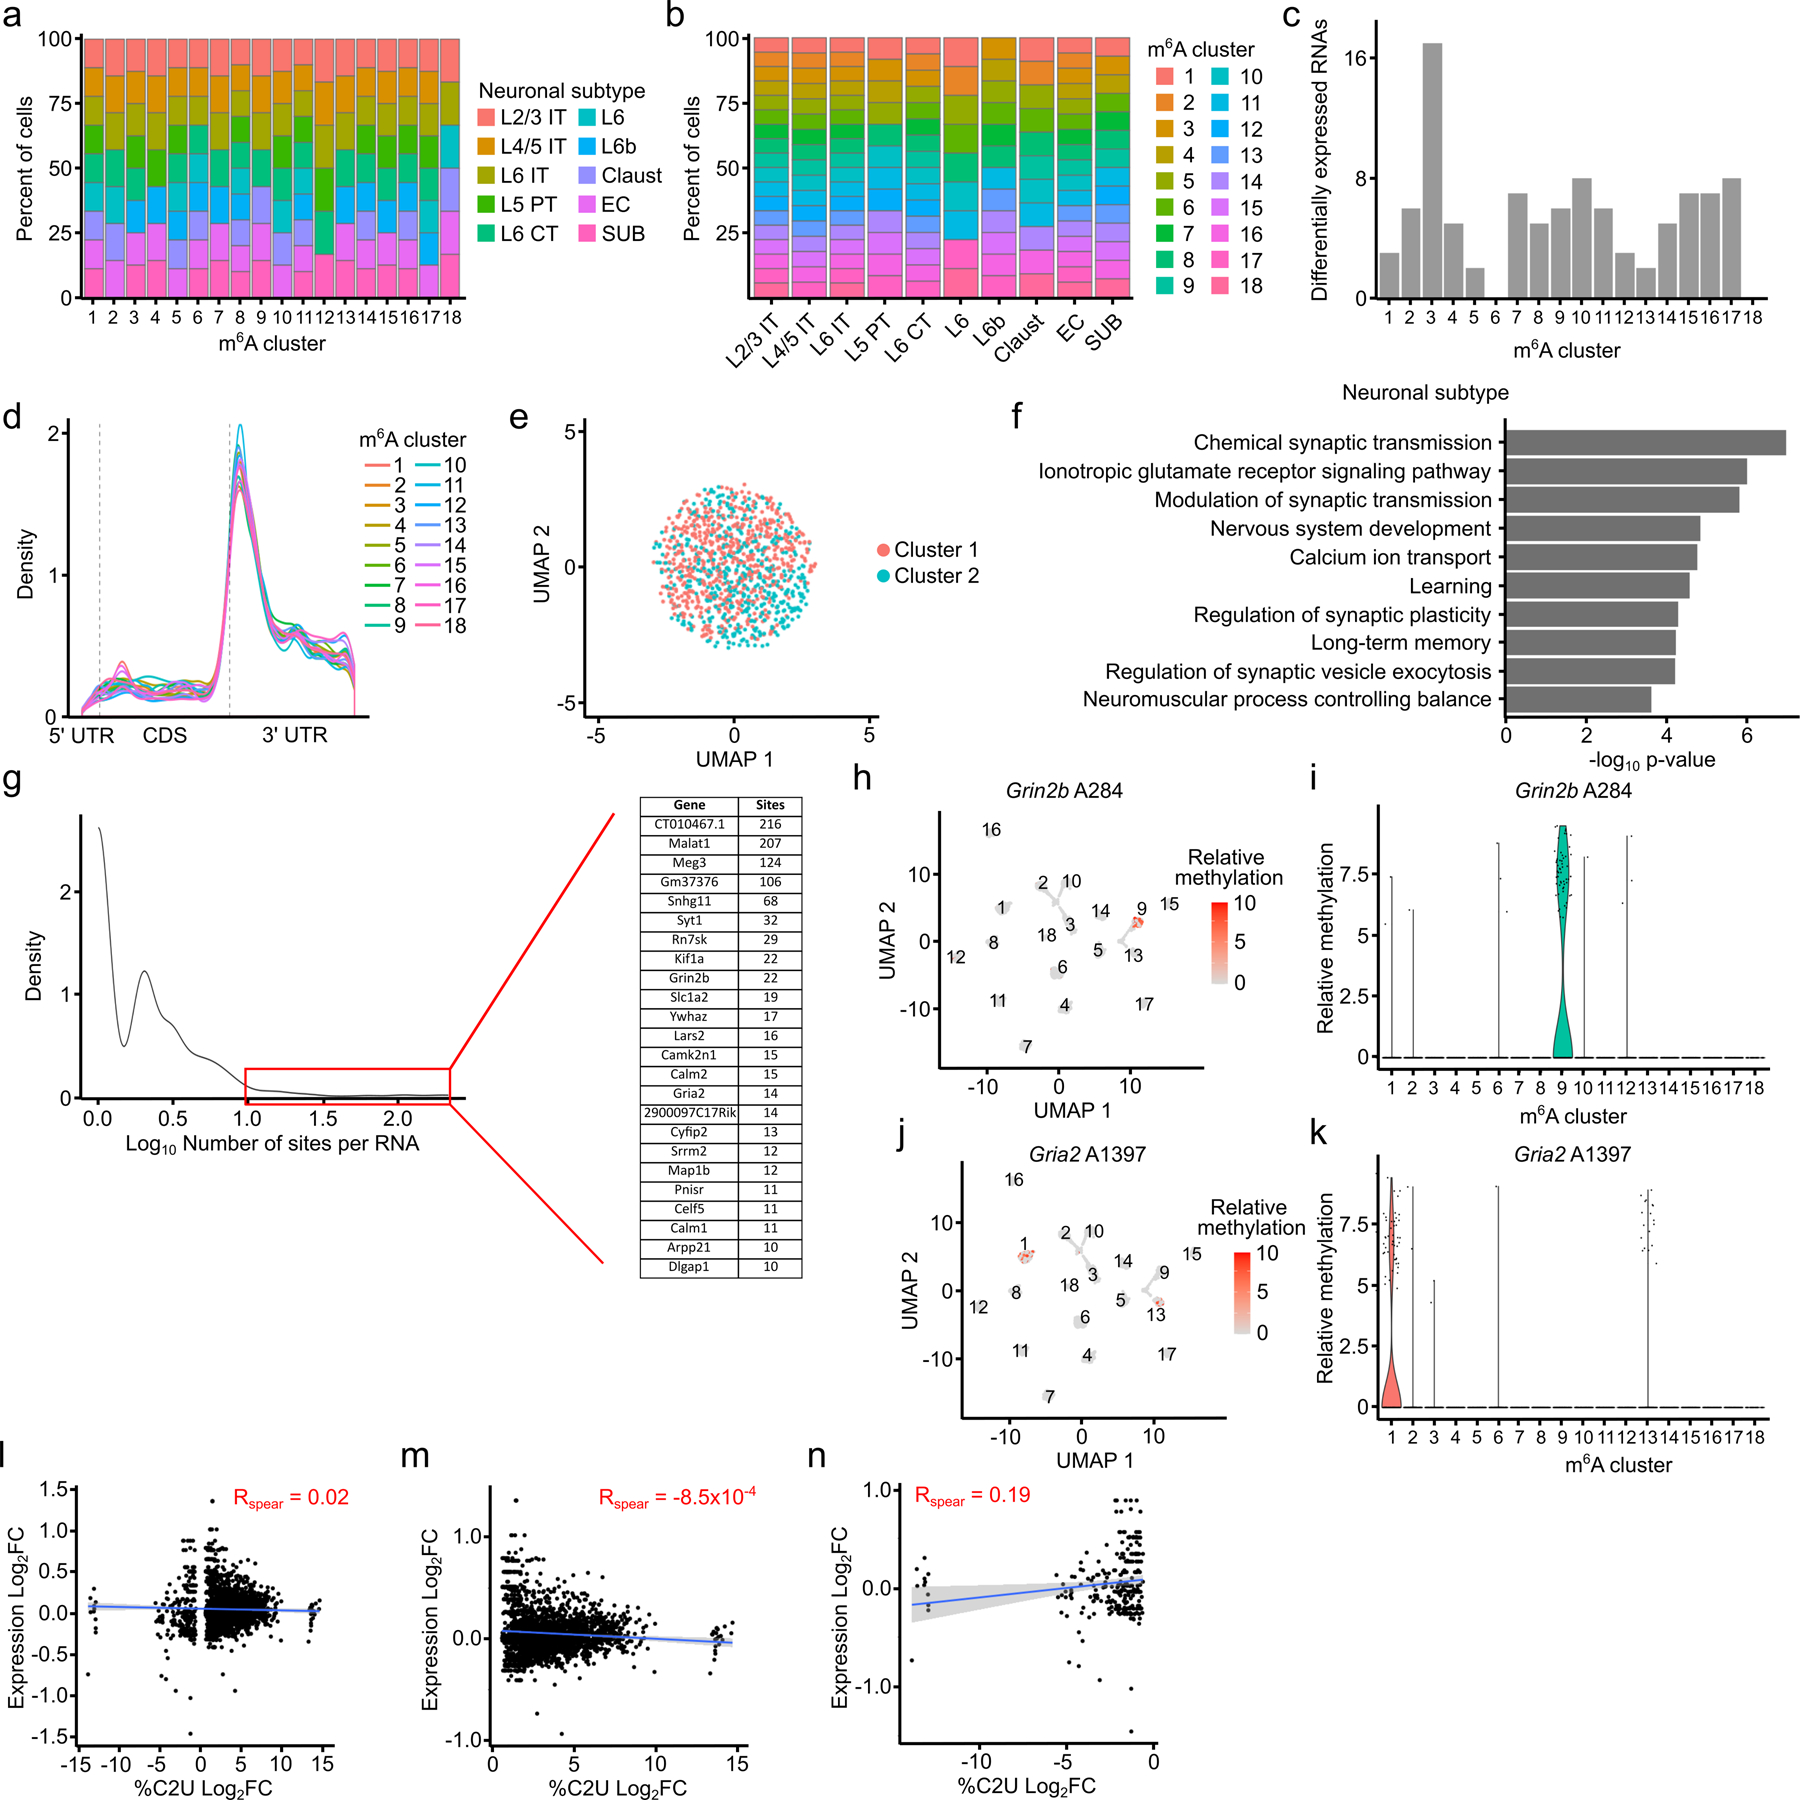
Extended Data Fig. 9 – Clustering by m6A reveals heterogeneous methylation in glutamatergic neurons.

a, Stacked bar plot showing the percentage of cells within each m6A cluster that belong to the corresponding neuronal subtype. b, Stacked bar plot showing the percentage of cells within each neuronal subtype belonging to different m6A clusters. c, Number of differentially expressed RNAs within each m6A cluster. d, Metagene plot showing distribution of m6A sites in each m6A cluster. e, UMAP visualization of m6A clustering using shuffled methylation data. %C2U values for all m6A sites were randomly shuffled across all cells. f, Top 10 Gene Ontology terms among all RNAs containing differentially methylated sites across m6A clusters. g, Density plot showing the distribution of the number of differentially methylated sites identified within each parent RNA. Highlighted region and inset indicate RNAs with at least 10 differentially methylated sites. h, UMAP visualization of relative %C2U values for site A284, the most significantly differentially methylated site in Grin2b, across m6A clusters. n = 2,246. i, Violin plot showing relative %C2U values for each cell within each m6A cluster for site A284 in Grin2b. j, UMAP visualization of relative %C2U values for site A1397, the most significantly differentially methylated site in Gria2, across m6A clusters. n = 2,246. k, Violin plot showing relative %C2U values for each cell within each m6A cluster for site A1397 in Gria2. l, Correlation between the log2-fold change in parent gene expression and the log2-fold change in %C2U for all differentially methylated sites found across m6A clusters. Blue line shows linear regression, gray band represents 95% confidence interval. Spearman correlation coefficient is shown. p = 0.40. n = 2,794. m, As in (l), but only showing sites with increased %C2U within each methylation cluster. p = 0.96. n = 2,533. Blue line shows linear regression, gray band represents 95% confidence interval. n, As in (l), but only showing sites with decreased %C2U within each methylation cluster. p = 0.002. n = 261. Blue line shows linear regression, gray band represents 95% confidence interval.
