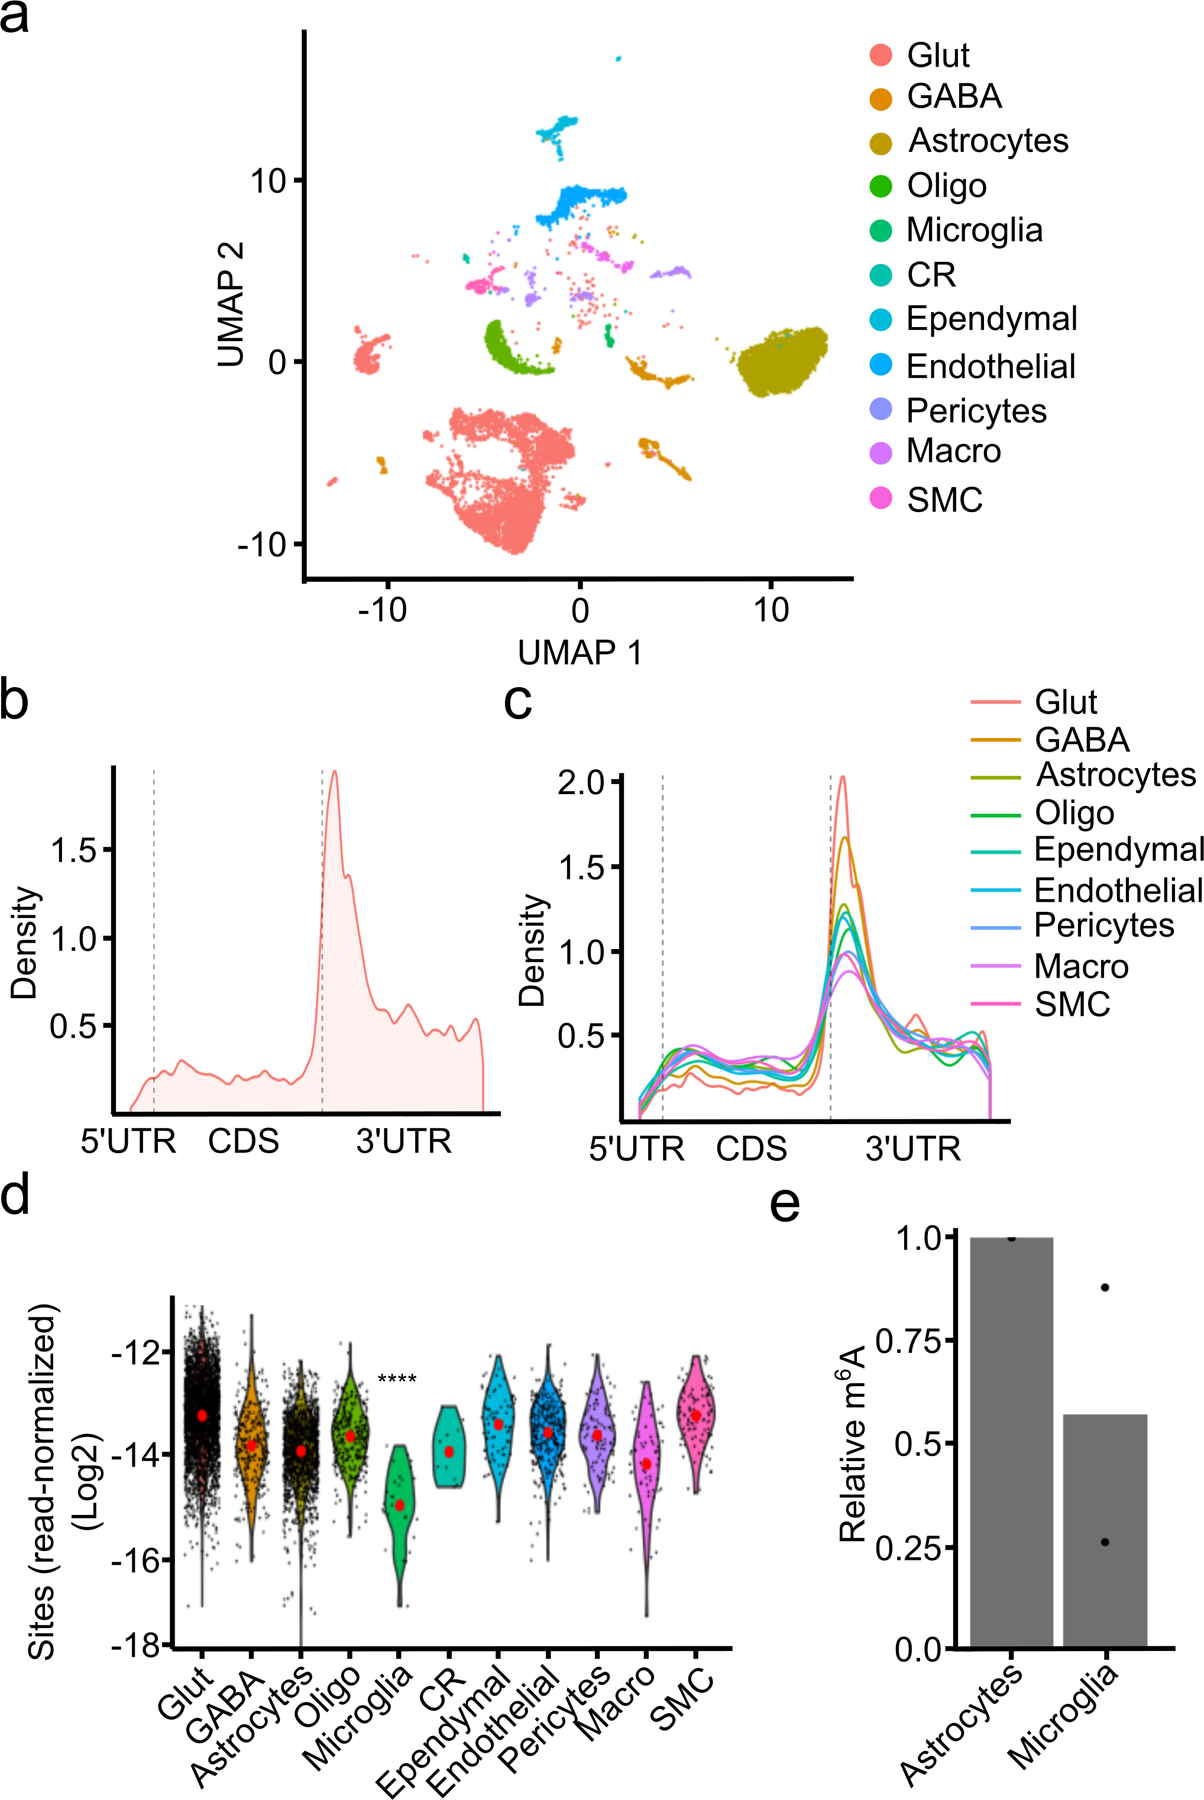
Fig. 2 – Single-cell m6A profiling in the mouse cortex.

a, UMAP visualization of cell types identified in the adult mouse cortex. b, Metagene analysis of m6A sites identified by scDART-seq across all cell types in the mouse cortex. c, Metagene analysis of m6A sites identified within each cell type classification. Cell types represented by fewer than 100 cells are omitted. d, Number of m6A sites identified in each cell type normalized by the total number of reads in the cell. Red dot indicates the mean. Significance was determined using a two-sided Wilcoxon rank-sum test comparing microglia to all other cells. **** = p < 0.0001. p = 2.73e−14. e, UPLC-MS data showing decreased m6A/A ratio in mRNA purified from microglia compared to astrocytes. n = 2 biological replicates. Glut = Glutamatergic Neuron; GABA = GABAergic Neuron; Oligo = Oligodendrocyte; Micro = Microglia; CR = Cajal-Retzius Cell; Macro = Peripheral Macrophage; SMC = Smooth Muscle Cell.
