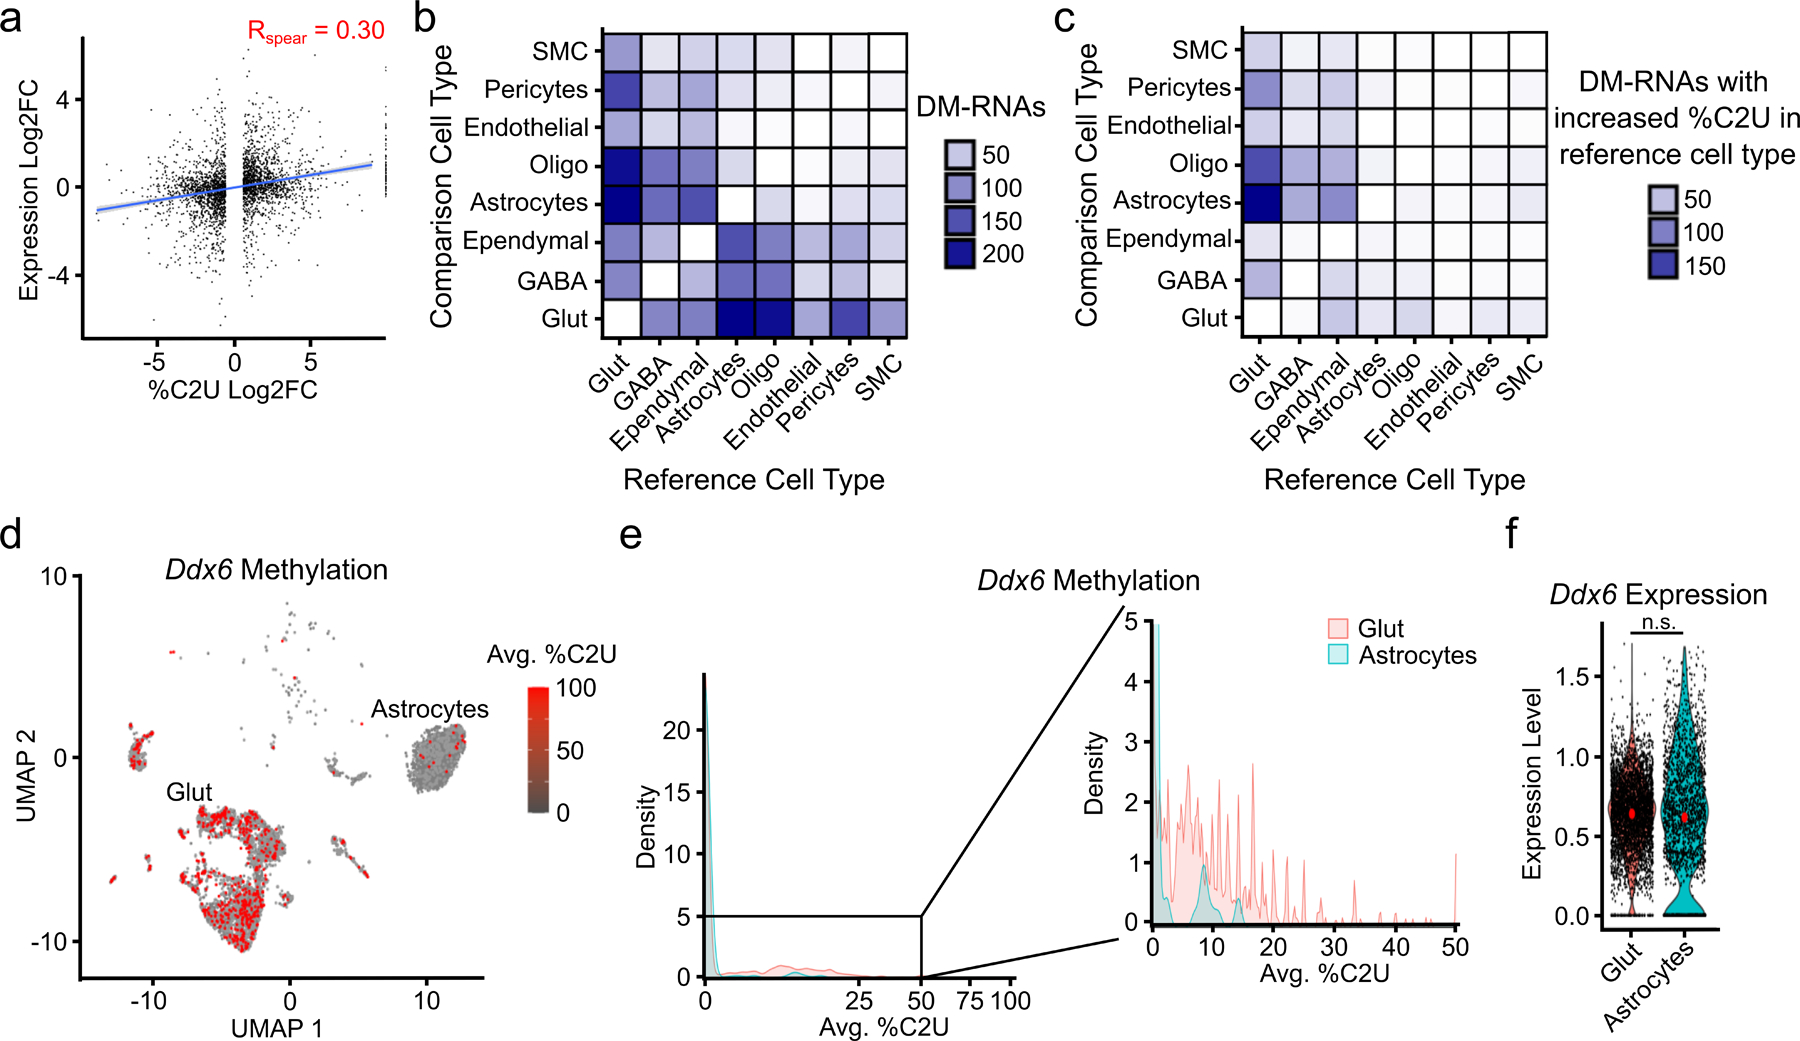
Fig. 3 – Differential methylation of RNA subsets across cell types in the mouse cortex.

a, Correlation between changes in methylation and gene expression for all 502 DM-RNAs identified across cell types. Blue line indicates linear regression, gray band represents 95% confidence interval. Spearman correlation coefficient is shown. p < 2.2 x 10⁻¹⁶. n = 2,872. b, Number of DM-RNAs identified between each pair of cell types in the cortex. Heatmap is colored by the number of DM-RNAs identified in the reference cell type relative to the comparison cell type. c, Heatmap showing the number of DM-RNAs with increased average %C2U in the reference cell type relative to the comparison cell type, colored by the number of DM-RNAs. d, UMAP visualization colored by the mean %C2U across all identified m6A sites in the Ddx6 mRNA, showing higher %C2U in glutamatergic neurons compared to astrocytes. Only cells with expression and coverage of Ddx6 are shown (n = 4,082). e, Density plot showing the distribution of average Ddx6 %C2U values within single cells in glutamatergic neurons and astrocytes. Region in black box is highlighted on the right. f, Violin plot showing the normalized expression of Ddx6 in glutamatergic neurons and astrocytes. n.s. = not statistically significant. Glut = Glutamatergic Neuron; GABA = GABAergic Neuron; Oligo = Oligodendrocyte; Micro = Microglia; CR = Cajal-Retzius Cell; Macro = Peripheral Macrophage; SMC = Smooth Muscle Cell.
