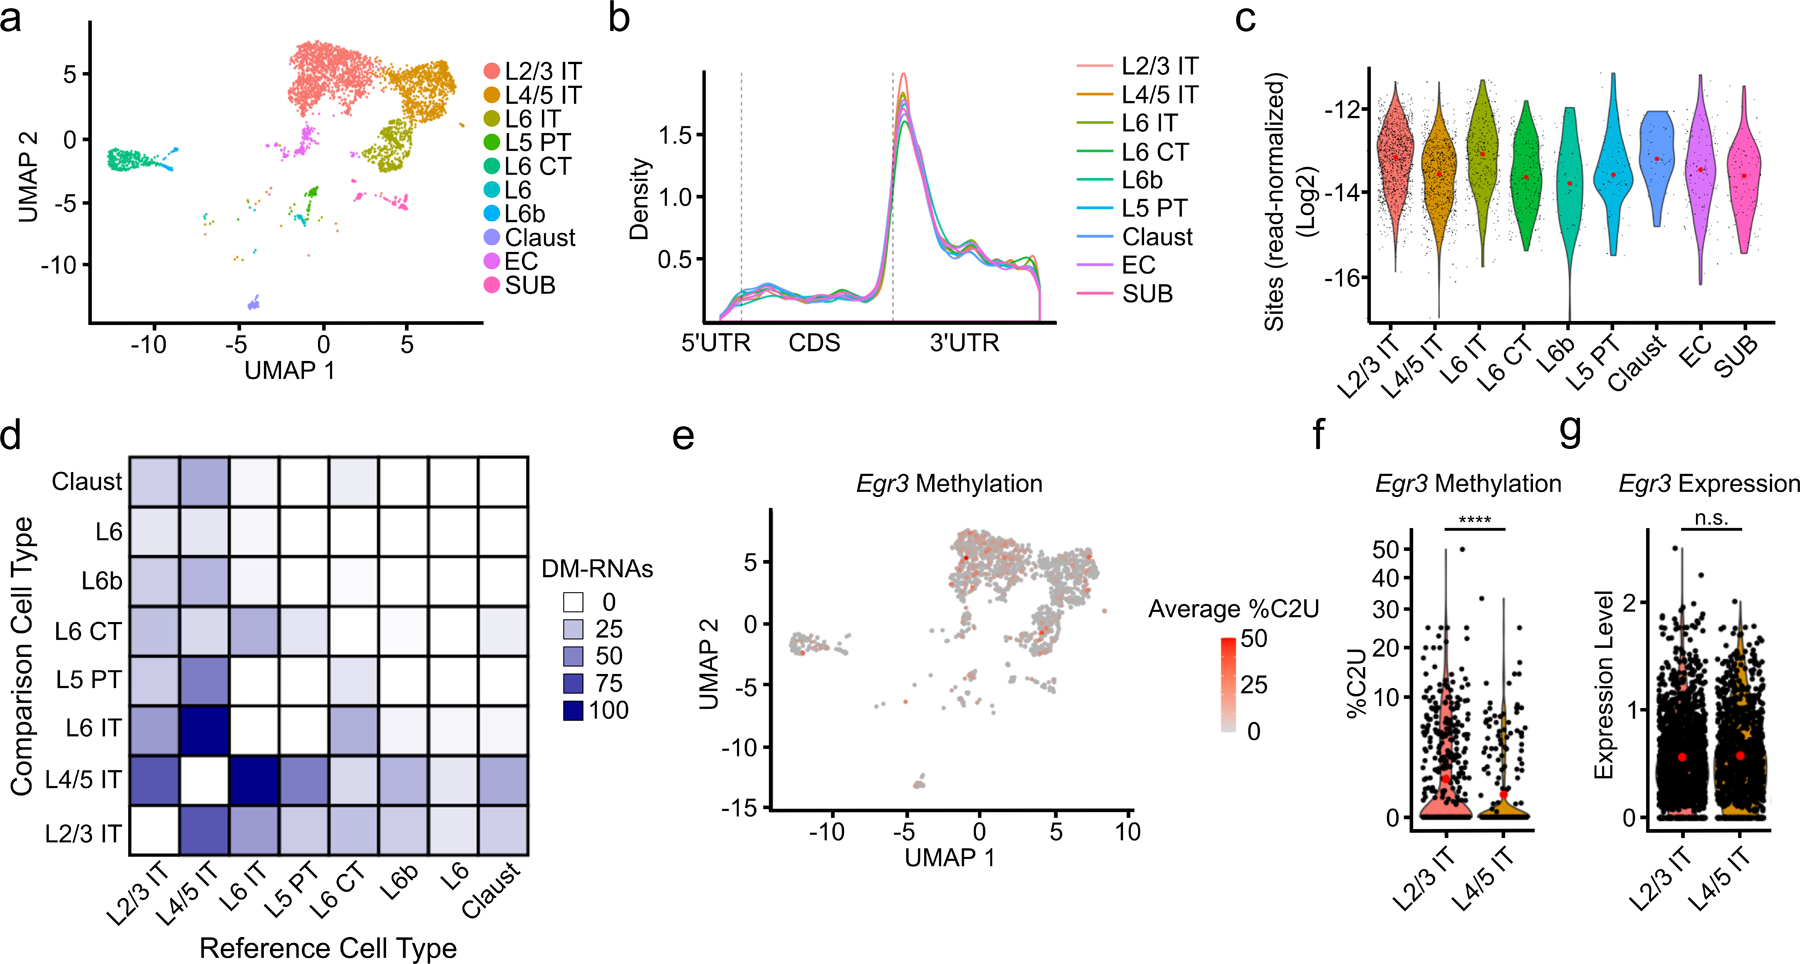
Fig. 4 – Patterns of m6A methylation across neuronal subtypes.

a, UMAP visualization of neuronal subtypes within the cortex. b, Metagene analysis of all m6A sites found in each neuronal subtype. c, Number of m6A sites identified in each cell normalized by the total number of reads in the cell and grouped by neuronal subtype. Red dot indicates mean value. d, Matrix showing the number of DM-RNAs identified between each pair of neuronal subtypes, ranging from 0 to 102. Boxes are colored by the number of DM-RNAs in the reference cell type relative to the comparison cell type e, UMAP visualization of neuronal subtypes colored by average %C2U of all sites identified in the Egr3 mRNA. Only cells with Egr3 expression and coverage are shown (n = 1,517). f, Violin plot showing the average single-cell %C2U values for all sites in the Egr3 mRNA in L2/3 IT and L4/5 IT neurons. Red dots indicate mean values. **** = p < 0.0001. Significance was determined using a two-sided Wilcoxon rank sum test with an FDR p-value adjustment. 5.79e−05. g, Violin plot showing the normalized gene expression values of Egr3 in L2/3 IT and L4/5 IT neurons. Red dots indicate mean values. Significance was determined using FindMarkers in Seurat (two-sided Wilcoxon rank-sum test was used, with Bonferroni p-value adjustment). p = 0.512. L2/3 = Layer 2/3; L4/5 = Layer 4/5; L6 = Layer 6; IT = Intratelencephalic; PT = Pyrimidal tract; CT = Corticothalamic tract; Claust = Claustrum; EC = Entorhinal cortex; SUB = Subiculum.
