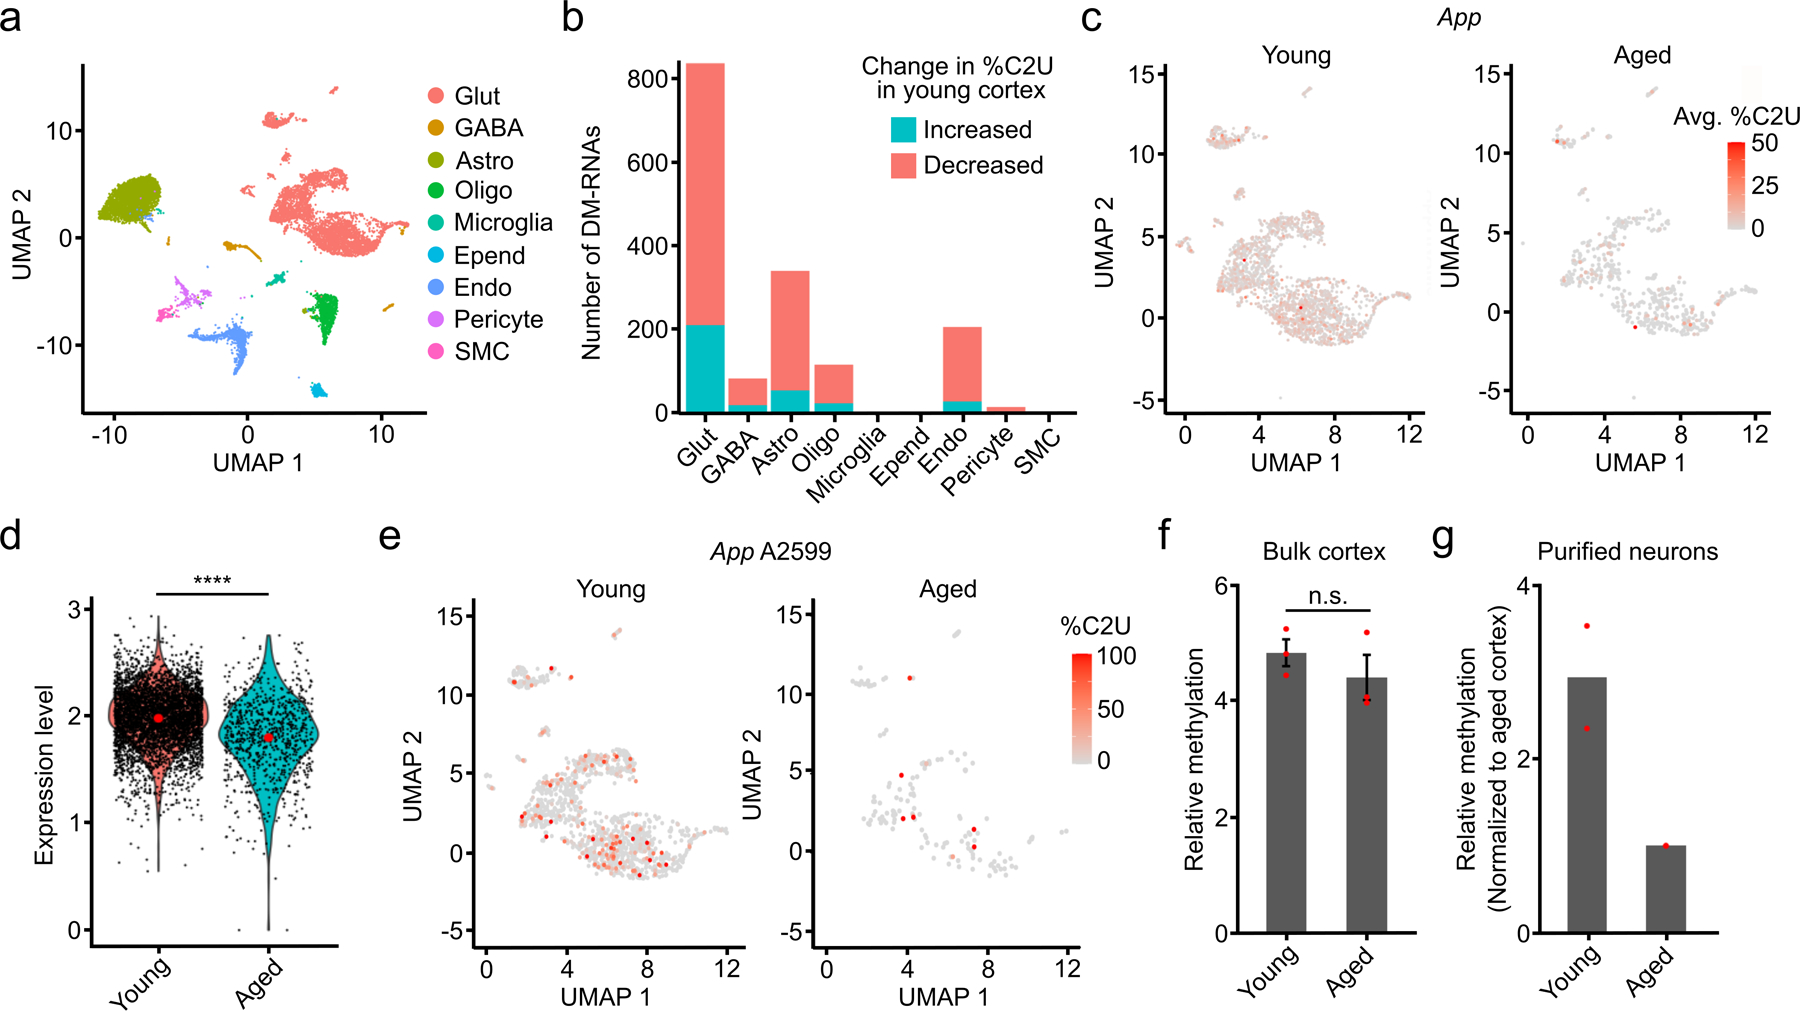
Fig. 6 – Analysis of differential methylation in the cortex during aging.

a, UMAP visualization of cortical cell types using integrated datasets from young and aged mice. b, Number of up- and downregulated DM-RNAs during aging in the indicated cell types. c, UMAP visualization of glutamatergic neurons from young and aged mice, colored by the average %C2U of all m6A sites identified in the App mRNA. Only cells with App expression and coverage are shown (young: n = 3,770; aged: n = 1,296). d, Normalized expression of App in young and aged neurons. Expression log2-fold change = −0.22 (young: n = 4,554; aged: n = 846). Significance was determined using FindMarkers in Seurat (two-sided Wilcoxon rank-sum test was used, with Bonferroni p-value adjustment). e, UMAP visualization of glutamatergic neurons from young and aged mice, colored by the %C2U value for site A2599 in the App mRNA. Only cells with App expression and coverage are shown (young: n = 1,876; aged: n = 335). f, Quantification of relative methylation at App A2599 in bulk cortex using RT-qPCR-based m6A quantification. n = 3 biological replicates. Significance was determined using a two-sided Wilcoxon rank-sum test. Error bars represent standard error. p = 1. g, RT-qPCR-based quantification of relative methylation at App A2599 in cortical neurons purified from young and aged mice. n = 2 biological replicates.
