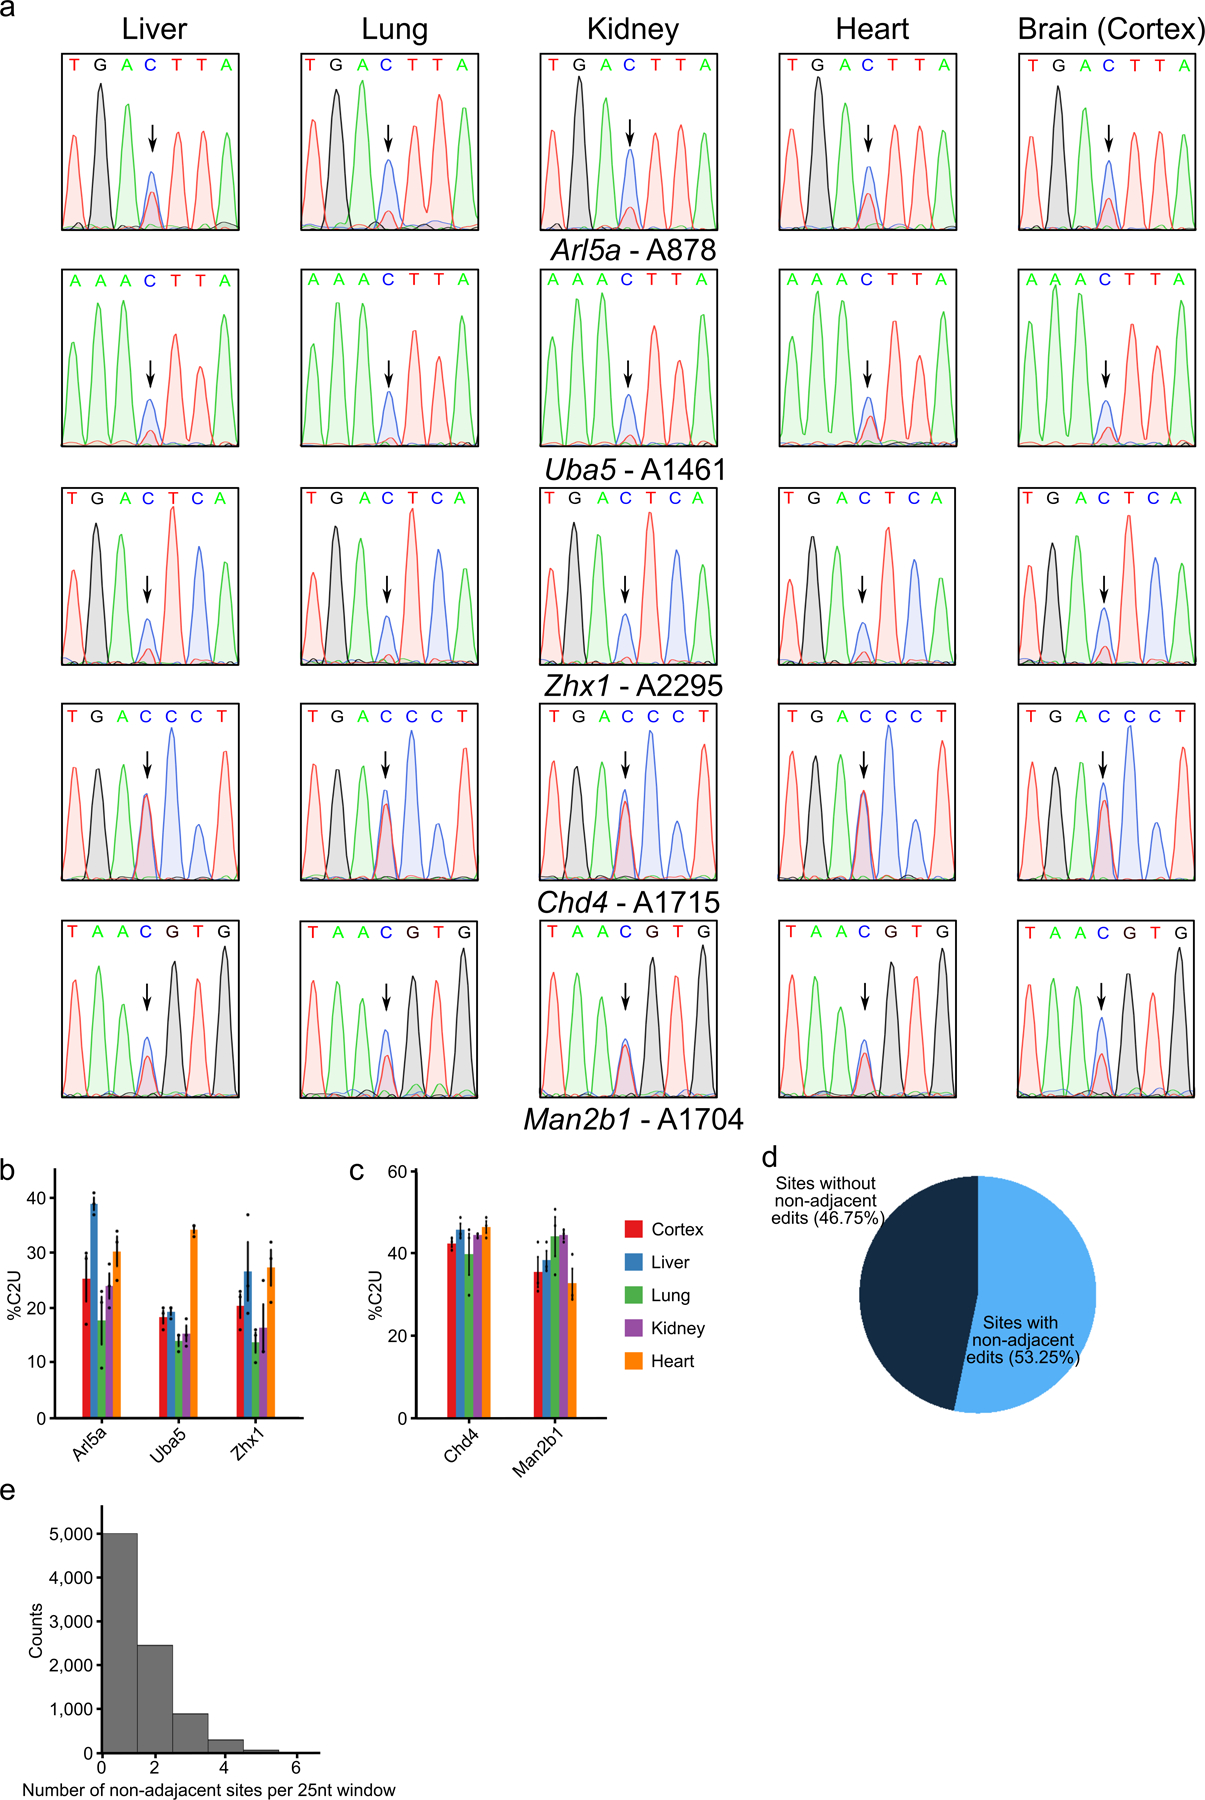
Extended Data Fig. 2 – Characterization of tamoxifen-inducible C-to-U editing at m6A sites in vivo.

a, Sanger sequencing traces indicating C-to-U editing adjacent to m6A sites in five different mRNAs across tissue types following tamoxifen induction of APOBEC1-YTH. Arrows indicate cytidines adjacent to m6A sites. Data are representative of 3 biological replicates. b, Quantification of editing percentage (%C2U) in each tissue for sites in the Arl5a, Uba5, and Zhx1 mRNAs. Methylation at the indicated sites differs across tissues. Error bars represent standard error (n = 3 biological replicates). Mean values for Arl5a: Cortex = 25.33, Liver = 39.0, Lung = 17.67, Kidney = 24.0, Heart = 30.33. Mean values for Uba5: Cortex =18.33, Liver =19.33, Lung = 14.0, Kidney = 15.33, Heart = 34.33. Mean values for Zhx1: Cortex = 20.33, Liver = 26.67, Lung = 13.67, Kidney = 16.33, Heart = 27.33. c, Quantification of editing percentage (%C2U) in each tissue adjacent to m6A sites in the Chd4, and Man2b1 mRNAs. Methylation at the indicated sites is consistent across tissues. Error bars represent standard error (n = 3 biological replicates). Mean values for Chd4: Cortex = 42.67, Liver = 46.0, Lung = 40.0, Kidney = 44.67, Heart = 46.67. Mean values for Man2b1: Cortex = 35.67, Liver = 38.67, Lung = 44.33, Kidney = 44.67, Heart =33.0. d, Pie chart indicating the proportion of m6A sites in the cortex with non-adjacent editing events within a 25nt window. e, Histogram showing the number of non-adjacent editing events observed in each 25nt window for the 53% of m6A sites in (d) that contain non-adjacent edits.
