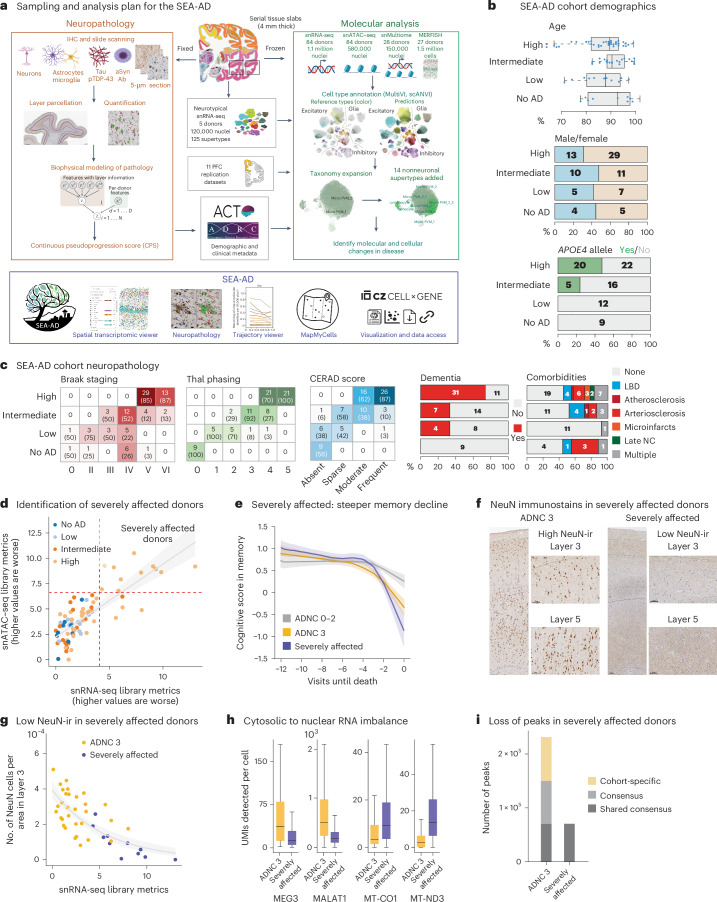
Fig. 1. SEA-AD study of the MTG and cohort description.
a, Schematic detailing the experimental design for applying quantitative neuropathology, snRNA-seq, snATAC–seq, snMultiome and MERFISH to the MTG of SEA-AD donors. b, SEA-AD cohort demographics, depicting age at death, biological sex and APOE4 allele, stratified according to ADNC score. Age at death is represented by box-and-whisker plots with the box representing the interquartile range (IQR) and the whiskers representing 1.5 times the IQR. The solid line indicates the median. c, SEA-AD cohort composition stratified according to ADNC versus Braak stage Thal phase (left), and CERAD score as heatmaps, with dementia or comorbidities as bar plots. The number of donors in each box and the fraction are shown in parentheses. d, First PC for snRNA-seq versus snATAC–seq quality control metrics for each library color-coded according to ADNC category. The dashed red lines indicate the point where values are above 1.5 times the IQR. The gray line represents the linear regression (Pearson R = 0.80) e, The center lines represent the mean of the locally estimated scatter plot smoothing (LOESS) regression on longitudinal cognitive scores in the memory domain across ADNC 0–2 donors in gray, ADNC 3 donors in gold and ADNC 3 severely affected donors in purple. Uncertainty represents the s.e. from 1,000 LOESS fits with 80% of the data randomly selected in each iteration. f, Exemplar low-power and high-power micrographs showing the entire cortical column and cortical layers 3 and 5 from an ADNC3 donor (left) and a severely affected donor lacking NeuN-ir (right). Immunostaining was performed in the entire SEA-AD cohort (n = 84). g, Scatter plot showing the number of NeuN immunoreactive cells per area in cortical layer 3 versus the PC for snRNA-seq in d. Severely affected donors (purple) localize at the end of this trajectory. Gray, logistic regression; error bars, s.d. h, Box-and-whisker plots showing the number of unique molecular identifiers (UMIs) detected per cell for MEG3 and MALAT1, MT-CO1 and MT-ND3, ADNC high donors or severely affected donors. Outliers are not shown. n = 543,252 represents the total number of cells across selected donors. i, Bar plot showing the number of chromatin accessible regions in 11 randomly selected ADNC high donors or severely affected donors. ‘Shared consensus’ are regions shared across both groups; ‘consensus’ denotes regions shared across members of each group; and ‘cohort-specific’ depicts peaks unique to some members of each cohort. The cohort demographics can be found in Supplementary Table 1. f, Scale bar, 100 μm. Schematics in a created using BioRender.com.

