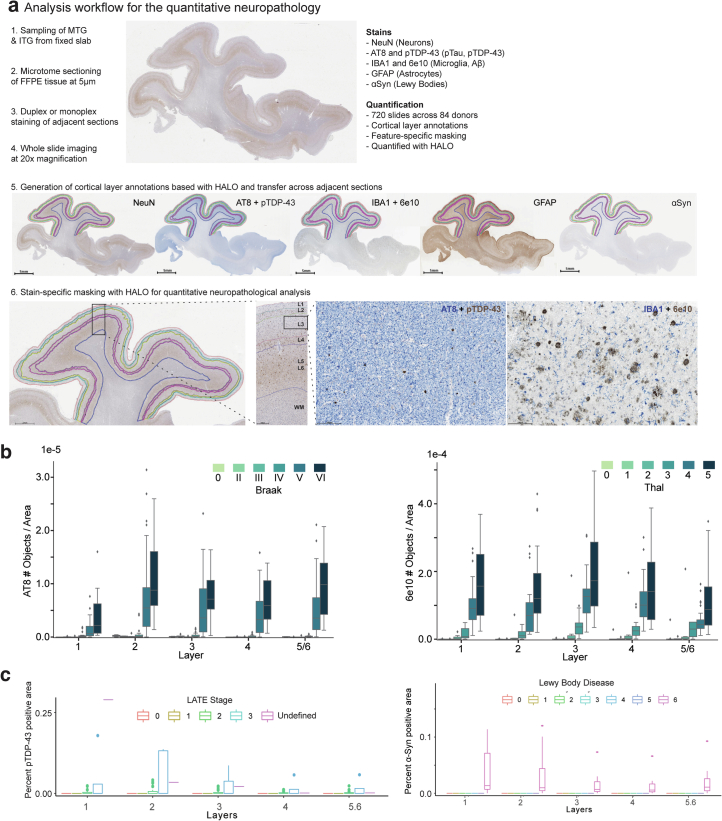
Extended Data Fig. 3. Human MTG neuropathological stains track brain-wide pathological states.
a) Schematic depicting neuropathological data acquisition pipeline (ordered 1 to 6). b) Boxplots showing the number of pTau-bearing cells per unit area organized by Braak stage (left) and number of Aβ plaques per unit area organized by Thal phase (right) across donors. Note, in later stages there is considerable variability in plaque and tangle number, underscoring limitations in classical staging. c) Boxplots showing the percent of pTDP-43-positive voxels (left) and percent of α-Syn-positive (α-Synuclein) voxels across donors organized by to LATE-NC stage (left) and Lewy Body Disease stage (right). Lewy Body Disease is coded numerically (0=Not or Incompletely Assessed, 1=Not Identified, 2=Amygdala-predominant, 3=Brainstem-predominant, 4=Limbic (Transitional), 5=Olfactory bulb only, 6=Neocortical). Note, only donors in later stages have large accumulation of co-pathology. Cohort demographic can be found in Supplementary Table 1.

