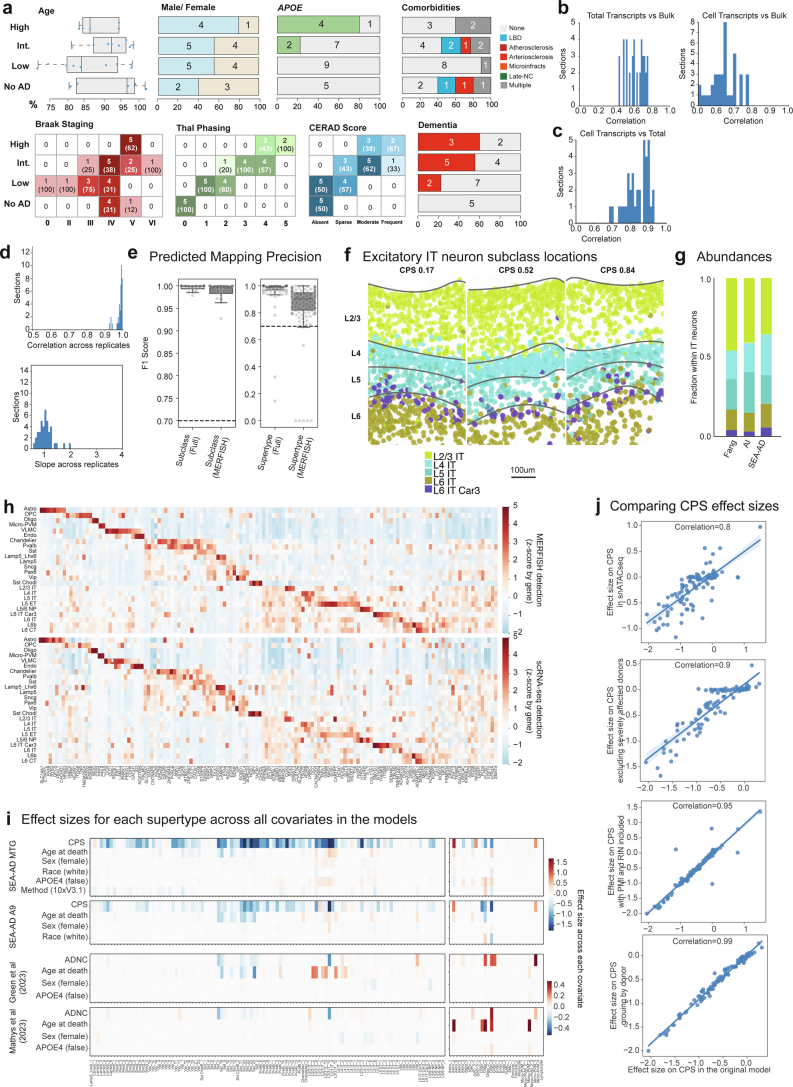
Extended Data Fig. 7. Pipeline for the acquisition of high quality spatial transcriptomic data in the human MTG.
a) Top, SEA-AD MERFISH cohort demographics stratified by AD neuropathological change (ADNC) score. Numbers indicate the number of donors in each group. b) Histograms showing the correlation between total slide transcripts (left) or transcripts within cells (right) and bulk RNAseq across sections. c) Histogram showing the correlation between total slide transcripts and transcripts in cells. d) Left, histogram showing the correlation in total slide transcripts across sections from the same donor. Right, Histogram showing the slope from a linear regression comparing total slide transcripts across sections from the same donor. e) Box and whisker plot showing F1 scores for subclasses (left) and supertypes (right) from the procedure where 1 donor was systematically held out at a time in neurotypical reference snRNA-seq data where the model could use all genes (Full) or only the 140 genes in the MERFISH panel (MERFISH). f) Scatterplots showing the positions of excitatory IT neurons as dots from example sections from donors with an early (0.17), middle (0.52) and late (0.84) CPS color coded by their subclass. g) Barplot showing the relative abundance of excitatory IT neurons across data collection efforts in neurotypical specimens from previous studies compared to SEA-AD data. h) Heatmaps showing the average gene expression levels of genes included in the 140 gene MERFISH panel at the subclass level in snRNA-seq (top) and MERFISH (bottom) data from MTG. i) Heatmaps showing the effect sizes of relative abundance changes along each covariate from neuronal (left) and non-neuronal (right) scCODA models MTG dataset, the SEA-AD snRNA-seq A9 dataset, Green et al. (2023) snRNA-seq dataset, and Mathys et al. (2023) snRNA-seq dataset. j) Scatterplots relating the effect sizes of each supertype along CPS from scCODA model on SEA-AD MTG dataset to a similar model run on SEA-AD snATAC-seq MTG dataset, to a model run without the severely affected donors, then including post-mortem interval (PMI) and RIN as covariates (third) and grouping data by donor instead of by library. Cohort demographic can be found in Supplementary Table 1.

