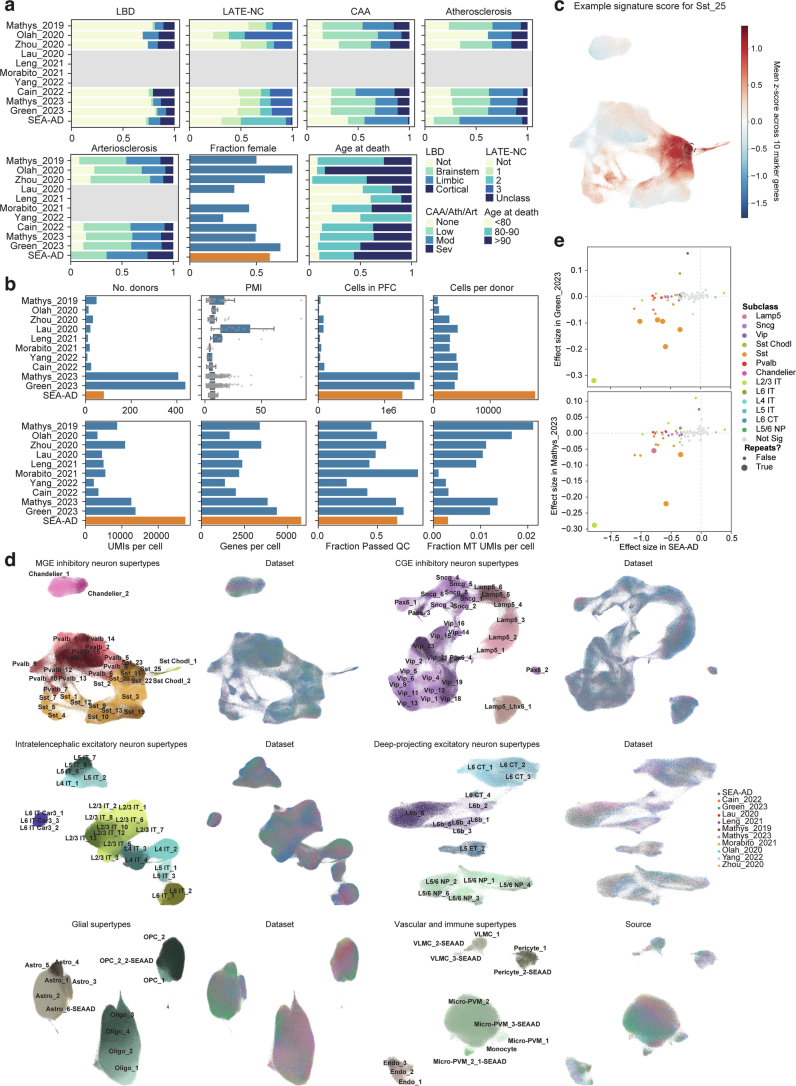
Extended Data Fig. 9. Integration of publicly available snRNA-seq datasets.
a) Barplots showing the fraction of donors in each of the publicly available snRNA-seq datasets that we harmonized metadata for and integrated classified in co-pathology neuropathological stages (LBD, Lewy Body Disease; LATE-NC, limbic-predominant age-related TDP-43 encephalopathy neuropathologic changes; CAA, Cerebral amyloid angiopathy; Ath, Atherosclerosis; Art, Arteriosclerosis), that were female, or were in defined age groups. Grey boxes, metadata that was unavailable. b) Box and whisker or barplots showing quality control metrics across each of the publicly available datasets. Metrics for the SEA-AD A9 snRNA-seq dataset are shown at bottom in orange for comparison. c) Scatterplot showing UMAP coordinates for MGE-derived inhibitory interneuron supertypes across all publicly available and the SEA-AD A9 dataset. Nuclei or cells are colored based on the signature score for Sst_25, which are indicated with the black dashed circle. d) Scatterplots showing UMAP coordinates of all supertypes within their cellular neighborhoods (that is MGE-derived inhibitory neurons, CGE-derived inhibitory neurons, Intratelencephalic excitatory neurons, Deep-projecting excitatory neurons, glial cells, and vascular and immune cells. In each neighborhood on left are nuclei and cells colored by supertype and on right cells are colored by dataset. e) Scatterplots relating the effect size for the change in relative abundance across supertypes in the SEA-AD A9 dataset to those observed in the Green_2023 (top) and Mathys_2023 (bottom) datasets. Each point is a supertype colored by their subclass and supertypes that are significant in both datasets have bigger circles. Dashed grey lines are at 0. Note, several Sst, 1 L2/3 IT and 1 Lamp5 supertypes that have significant negative effect sizes in both datasets. Cohort demographic can be found in Supplementary Table 1.

