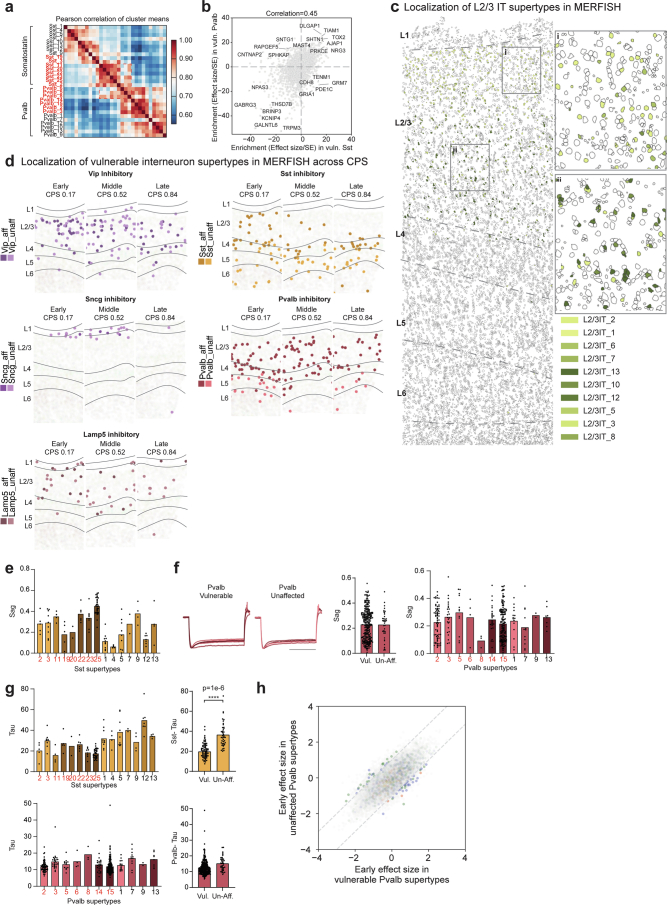
Extended Data Fig. 10. Characteristics of vulnerable neuronal supertypes.
a) Heatmap showing the pairwise correlations of the mean expression of all genes across the MGE-derived supertypes indicated. Red labels are vulnerable supertypes. b) Scatterplot relating the mean enrichment (defined as the effect size divided by its standard error (SE) from NEBULA) of each gene in vulnerable (vuln) Sst and Pvalb supertypes compared to unaffected types in their respective subclasses. c) MERFISH-profiled brain slice in early CPS donor (CPS = 0.23) showing each cells location and boundaries defined by the cell segmentation, with cortical layers indicated (L1-L6) and separated by dashed grey lines. Vulnerable L2/3 intratelencephalic (IT) neurons are color-coded. Insets: i) L2/3 IT supertypes have characteristic depths within layers 2 and 3. d) Scatterplots showing the spatial locations of individual cells of the inhibitory neuron subclasses indicated from representative MERFISH sections in donors at increasing CPS stages. Vulnerable supertypes (aff) are shown in darker colors and unaffected supertypes (unaff) in lighter ones. e) Bar and swarm plot showing the Sag values for Sst supertypes from PatchSeq data on non-AD donors. Vulnerable supertypes are colored in red. f) Left, electrophysiological traces showing post-spike hyperpolarization of membrane potential (y-axis) over time in almost all Pvalb neurons from tissue of non-AD human donors that underwent surgical resection. Middle, bar and swarm plot showing Sag distributions in individual vulnerable (Vul) and unaffected (Unaff) Pvalb neurons. Right, Bar and swarm plot showing the Sag values for Pvalb supertypes from PatchSeq data on non-AD donors. Vulnerable supertypes are colored in red. g) Left top and bottom, Bar and swarm plot showing the Tau apparent membrane time constant values for Sst (top) and Pvalb (bottom) supertypes from PatchSeq data on non-AD donors. Vulnerable supertypes are colored in red. Middle top and bottom, Bar and swarm plots for data on left grouped by vulnerable (vul) and unaffected (un-aff) Sst (top) and Pvalb (bottom) supertypes. Logistic regression test is described in ‘Identifying differential electrophysiological features’, p-value = 1e-6. P-values for all differential electrophysiological features are in Supplementary Table 8. h) Scatterplot relating the mean early effect size of each gene (dots) in vulnerable versus unaffected Pvalb supertypes. Cohort demographic can be found in Supplementary Table 1.

