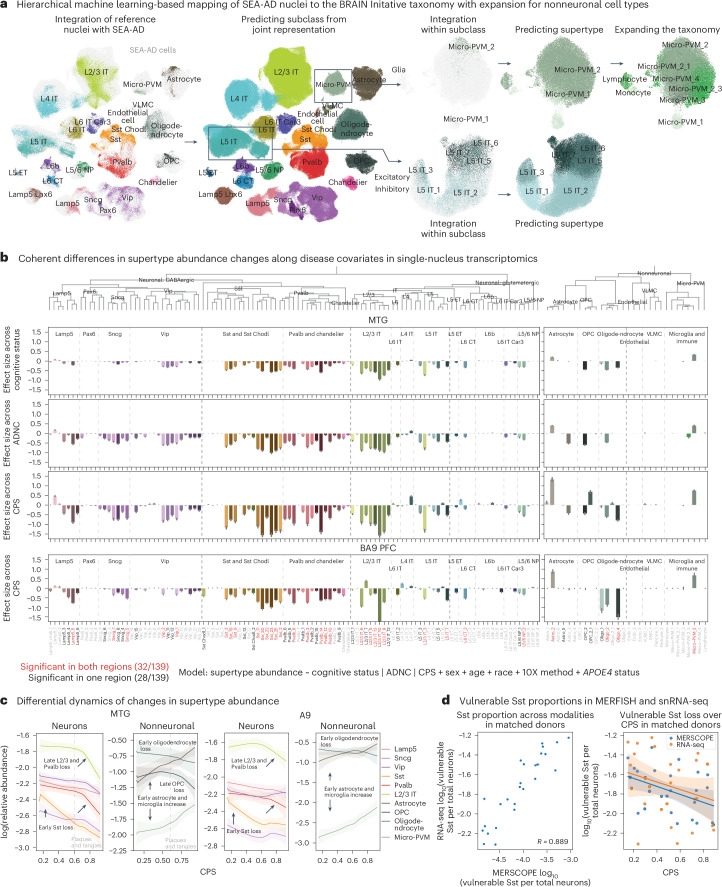
Fig. 3. Vulnerable populations in the MTG concentrate around superficial supragranular layers.
a, Schematic showing the hierarchical mapping procedure used to create the SEA-AD taxonomy and annotate all SEA-AD cells. Reference MTG cells were used to define neuronal supertypes (Methods). SEA-AD nuclei are colored light gray. Cell subclasses and supertypes are indicated. b, Bar plots showing the effect sizes for relative abundance changes in MTG associated with cognitive status (top), ADNC (middle) or CPS (bottom), controlling for sex, age, single-cell technology and APOE4 status. Below, effect sizes for A9 across CPS, controlling for sex, age at death and race. Red, significantly changed in both cortical regions; dark gray, significantly changed in one cortical region; light gray, not significantly changed. The light gray lines separate subclasses in the same cellular neighborhood; darker gray lines separate cellular neighborhoods. The bar plots and lines represent the average and s.e.m. over 139 compositional tests in which we rotated the reference population. In each test, n = 82 donors were used to fit the model. c, Center lines are the mean of the LOESS regressions relating the log-normalized relative abundance (within all neuronal or all nonneuronal nuclei) of supertypes that were significantly changed in the MTG (two plots on the left) or A9 (two plots on the right) to the CPS. Supertypes were grouped according to their subclasses to facilitate visualization of how each set of supertypes changed. Sst supertypes decreased in their relative abundance early in CPS, before an exponential increase in the number of plaques and tangles present (indicated on each plot with a dashed light gray line). In contrast, L2/3 IT and Pvalb supertypes decrease as AD pathology increases. Uncertainty in each line represents the s.e. from 1,000 LOESS fits with 80% of the data randomly selected in each iteration. d, Left, scatter plot showing the correlation of vulnerable Sst supertype relative abundance in snRNA-seq and MERFISH data from matched donors (R = 0.84). Right, scatter plot relating the relative abundance of vulnerable Sst supertypes to CPS in the snRNA-seq (orange) and MERFISH (blue) datasets from the same donors. The lines represent the linear regression fits; the error bars are the s.e. from 1,000 bootstraps using 80% of the data in each. The cohort demographics can be found in Supplementary Table 1.

