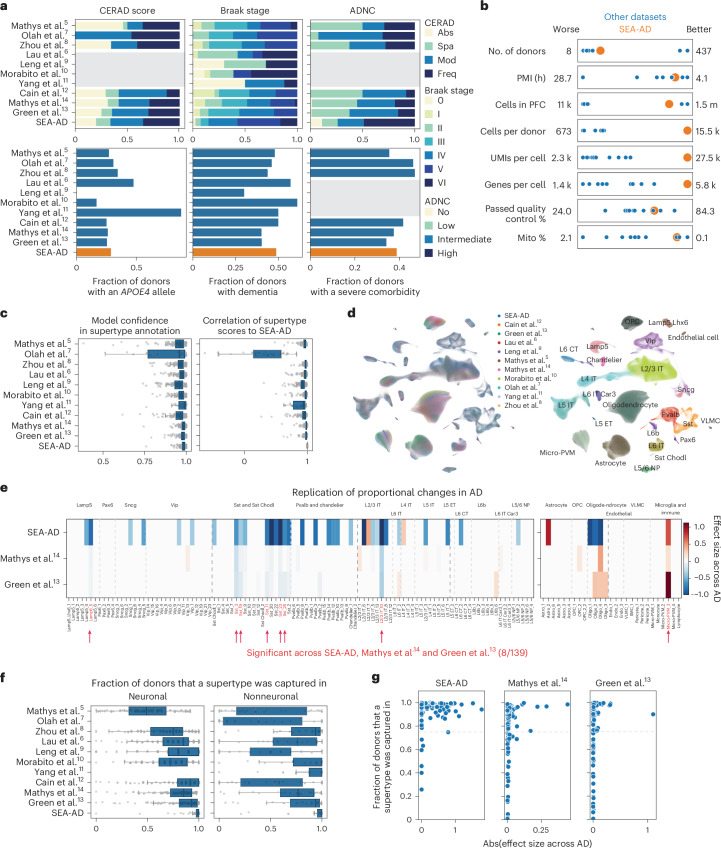
Fig. 4. A9 single-nucleus data integration replicates MTG vulnerable populations with AD.
a, Bar plots showing the fraction of donors in each publicly available snRNA-seq dataset harmonized in this study. Neuropathological stages (top) or possessing an APOE4 allele, dementia or a severe comorbidity (bottom). Gray boxes, unavailable metadata. Neuropathological staging included CERAD score, Braak stage and ADNC. All datasets applied snRNA-seq to the prefrontal cortex (PFC) in human donors that contained sporadic AD cases. Abs, absent; Spa, sparse; Mod, moderate; Freq, frequent. b, Scatter plots showing the relative study size, dataset depth and mean quality control metrics across publicly available snRNA-seq datasets (shown as blue dots) and SEA-AD (shown as a larger orange dot). c, Left, box-and-whisker plot showing the mapping confidence across datasets for each supertype. Right, box-and-whisker plot showing the Spearman correlation of each supertype’s signature score across all nuclei in each dataset compared to the SEA-AD. d, Scatter plot showing the uniform manifold approximation and projection (UMAP) coordinates computed from the integrated latent representation of cells and nuclei from the SEA-AD snRNA-seq dataset on A9 and each publicly available dataset color-coded according to dataset of origin (left) or subclass (right). e, Heatmap comparing the effect size of the relative abundance change of each supertype in A9 across CPS (SEA-AD) or ADNC (refs. 13,14), controlling for sex, age at death and race in the SEA-AD or sex, age and APOE4 status in refs. 13,14. Red indicates supertypes that were significantly changed in abundance across all three studies. The light gray dashed lines separate subclasses within cellular neighborhood; darker gray lines separate cellular neighborhoods. f, Box-and-whisker plots showing the fraction of donors that each supertype was captured in across all 11 integrated datasets. n as in c. n represents the total number of cells in each study dataset ordered as in the figure from top to bottom: 32,312, 11,020, 77,791, 77,631, 25,267, 44,514, 28,064, 89,358, 1,502,282, 1,420,559, 1,330,571. g, Scatter plots relating the effect size for each supertype to the fraction of donors for which the supertype was captured in. No populations captured in less than 75% of profiled donors were detected as significant across all studies. The cohort demographics can be found in Supplementary Table 1.

