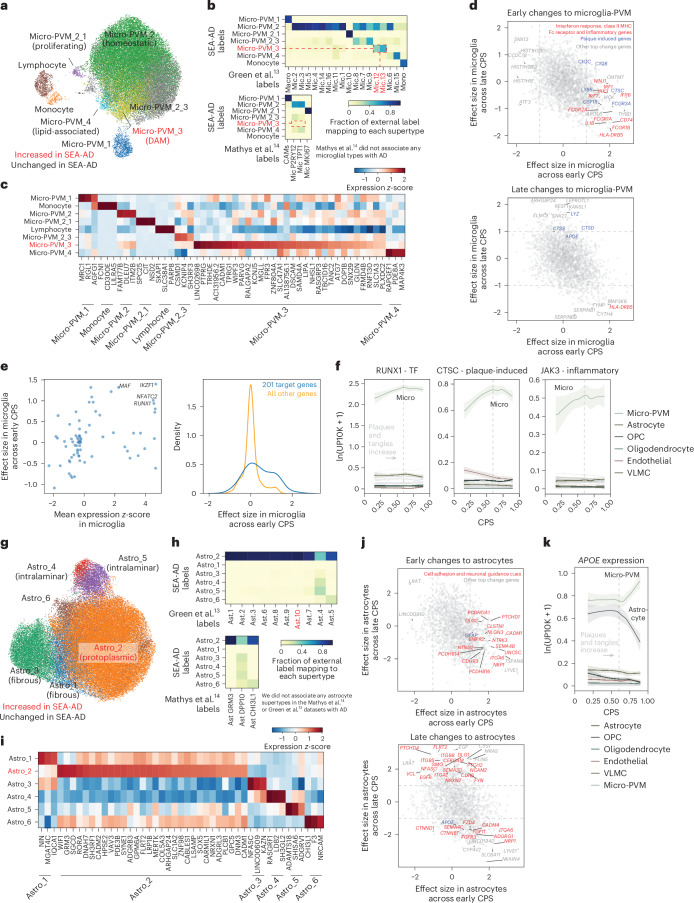
Fig. 6. Early microglial and astrocyte activation compared across publicly available datasets.
a, Scatter plot showing the UMAP coordinates for MTG micro-PVM supertypes, colored according to supertype identity. Red, disease-associated microglial state. b, Heatmaps showing confusion matrices comparing microglial annotations in refs. 13,14 with the SEA-AD cellular taxonomy. Red, SEA-AD supertypes significantly increased in all datasets. c, Heatmap showing the mean z-scored expression across microglial supertypes of marker genes identified using Nebula. d, Scatter plot relating the mean effect size of each gene across microglial supertypes in the early versus late epochs along the CPS. The gray dashed lines denote effect sizes of 1 and −1. The statistical test was a negative binomial regression implemented in Nebula, together with gene family enrichment tests as described in the Methods and Supplementary Note. e, Left, scatter plot relating transcription factor mean z-scored gene expression identified by the GRNs versus the effect size in the early disease epoch along the CPS. Right, cumulative density plot depicting the effect sizes in the early disease epoch along the CPS of the genes downstream of the transcription factors identified based on the GRNs (left, in blue) versus the effect sizes of all other genes (yellow). f, LOESS regression plots relating the mean expression of the indicated genes from families noted in d to CPS across nonneuronal supertypes organized and colored according to subclass; ln(UP10K + 1), natural log UMIs per 10,000 + 1. g, Scatter plot showing the UMAP for the MTG astrocyte supertypes colored according to supertype identity. Red, disease-associated protoplasmic astrocyte supertype. h, Heatmaps showing the confusion matrices comparing the annotations of astrocyte cells in the studies in refs. 13,14, with the same cells annotated with the SEA-AD cellular taxonomy. i, Heatmap showing the mean z-scored expression across astrocyte supertypes of marker genes identified by Nebula. j, Scatter plot relating the mean effect size of each gene across astrocyte supertypes in the early (x axis) versus late (y axis) epochs along the CPS. The gray dashed lines denote effect sizes of 1 and −1. k, Same LOESS regression plots as in f for the strongly disease-associated APOE gene, which decreased in expression in astrocytes and increased in expression in microglia in the late disease epoch along the CPS. The cohort demographics can be found in Supplementary Table 1. TF, transcription factor.

