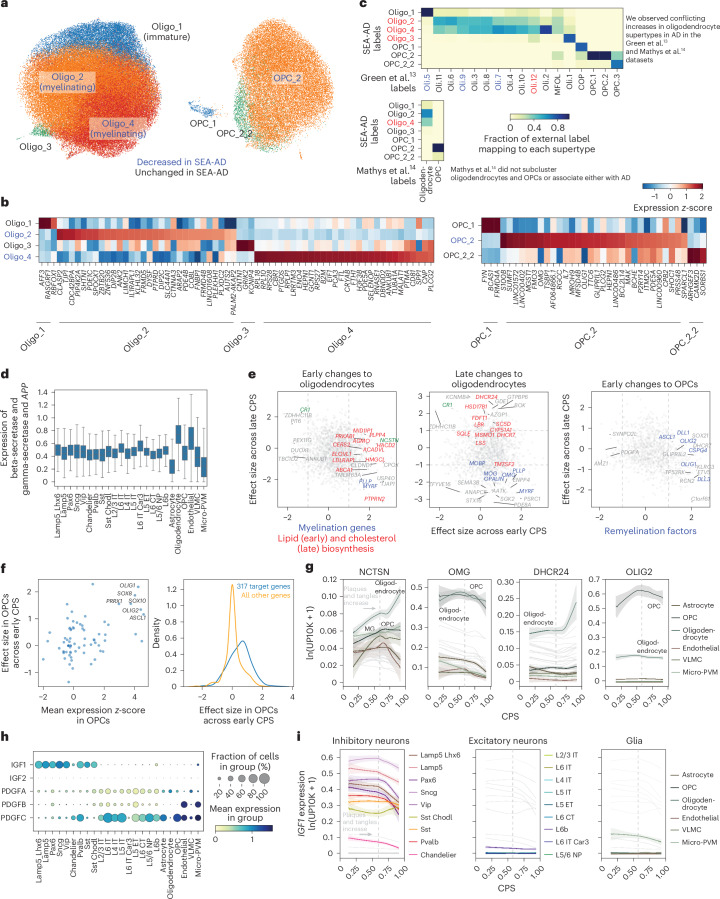
Fig. 7. Early loss of oligodendrocytes with a remyelination program in OPCs across publicly available datasets.
a, Scatter plots showing the UMAP coordinates for MTG oligodendrocyte and OPC supertypes, colored according to supertype identity. b, Heatmap showing the mean z-scored expression across oligodendrocyte (left) and OPC (right) supertypes of marker genes identified by Nebula. c, Heatmaps showing confusion matrices comparing oligodendrocyte and OPC annotations in refs. 13,14 with the SEA-AD taxonomy. Red, SEA-AD supertypes that were significantly increased in AD in these datasets. Red and blue also denote cell types that were associated or vulnerable with disease in the original studies. d, Box-and-whisker plot showing the mean expression (natural log UMIs per 10,000 + 1) of beta and gamma-secretase components and the APP gene organized according to subclass. The center lines denote the median; the error bars are 1.5 times the IQR. Outliers are not shown. e, Scatter plot relating the mean effect size of genes across the oligodendrocyte and OPC supertypes in the early versus late epochs. Significant genes involved in fatty acid biosynthesis (left) or cholesterol biosynthesis (middle, P = 0.0040 late) are color-coded red; myelin components (P = 0.006 late) are color-coded blue. Significant genes in the OPC early phase (right) that are part of the remyelination program (P = 9.62 × 10⁻⁵ early) are color-coded blue. The statistical test used was a negative binomial regression implemented in Nebula; gene family enrichment tests were carried out as described in the Methods and Supplementary Note. f, Left, scatter plot relating transcription factor mean z-scored gene expression identified by GRNs versus their effect size in the early disease epoch along the CPS. Right, cumulative density plot depicting the effect sizes in the early disease epoch of genes downstream of the transcription factors identified (left) based on the GRNs (blue) versus the effect sizes all other genes (yellow). n represents the number of OPCs, n = 28,429. g, LOESS regression plots relating the mean expression of the indicated genes from the families in e to the CPS, colored according to subclass. ln(UP10K + 1), natural log UMIs per 10,000 + 1. h, Dot plot depicting the mean gene expression and fraction of cells in each group with nonzero expression in the SEA-AD MTG dataset organized according to the subclasses for the genes indicated. Expression is natural log UMIs per 10,000 + 1. The statistical test was negative binomial regression implemented in Nebula; gene family enrichment tests were used as described in the Methods and Supplementary Note. i, LOESS regression relating the mean expression of IGF1 to CPS, color-coded by inhibitory (left), excitatory (middle) and nonneuronal (right) subclasses. The cohort demographics can be found in Supplementary Table 1.

