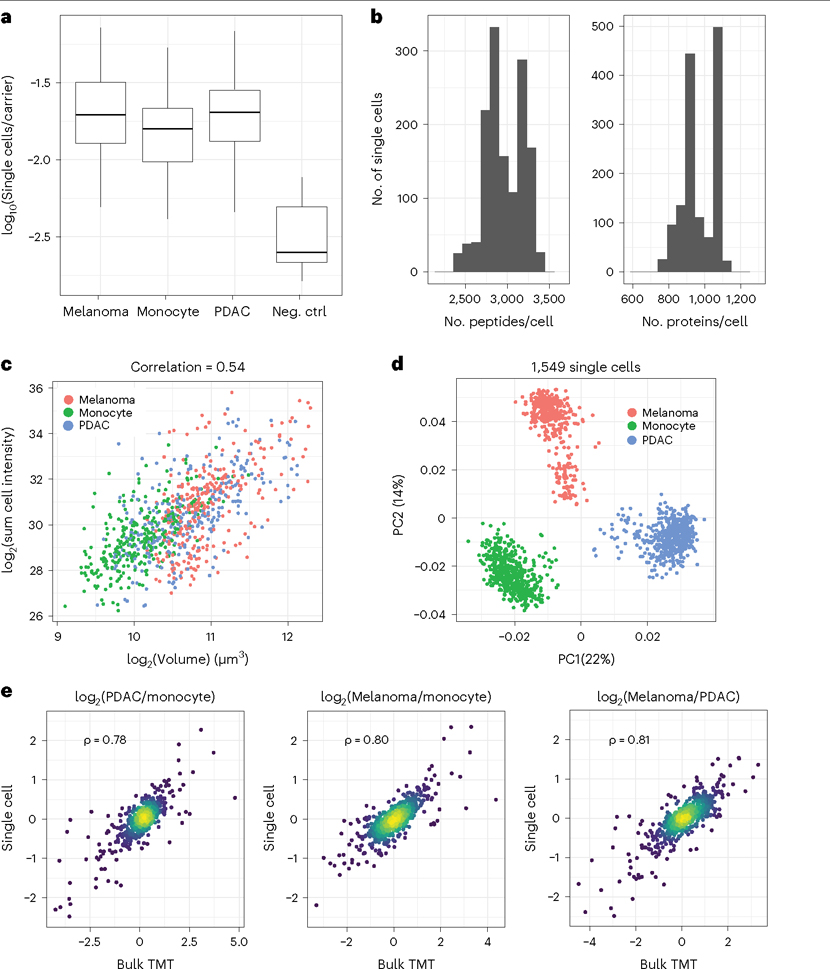
Fig. 7 |. Single-cell proteomics at >1,000 single-cell samples/d.
a, The average over all peptides of single-cell reporter ion intensities divided by the carrier reporter ion intensity for all single cells and negative controls (Neg ctrl). b, Distributions of peptide and protein numbers quantified per single cell. c, Cell volume correlates positively with summed peptide signal, which is a proxy for total protein content. This strong correlation indicates consistency of sample preparation. d, Principal component analysis shows that cells discretely cluster by cell type. The two clusters of melanoma cells correspond to previously characterized subpopulations in this cell line7. e, All pairwise protein fold changes between the three cell types were estimated from single-cell pSCoPE measurements by using nPOP and from bulk samples analyzed by using mPOP. The corresponding estimates were compared on a log2 scale. For each pair of cell types, single-cell fold changes were averaged in silico1.

