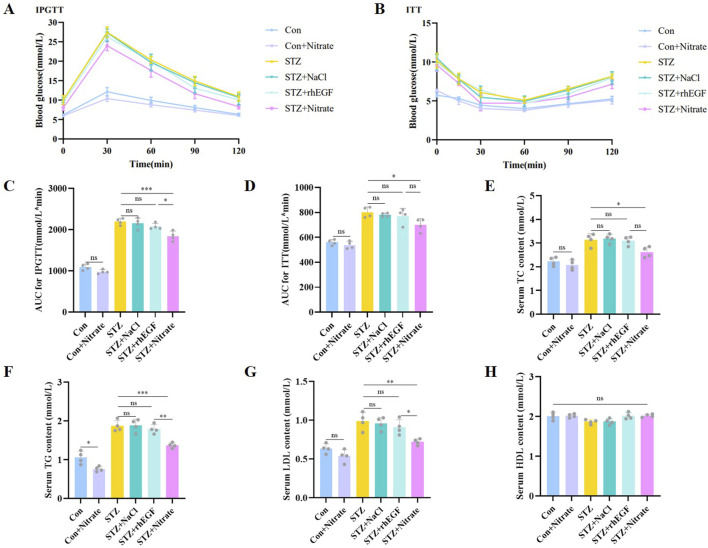
FIGURE 7.
Dietary nitrate modulated glucolipid metabolism in diabetic rats. (A) Glucose changes in the IPGTTs. (B) Glucose changes in the ITTs. (C) AUC for IPGTTs were presented in the column graph. (D) AUC for ITTs were presented in the column graph. Blood lipid indicators including TC (E), TG (F), LDL (G) and HDL (H) were measured at the end of the experiment. n = 4, * P < 0.05, ** P < 0.01, *** P < 0.001.

