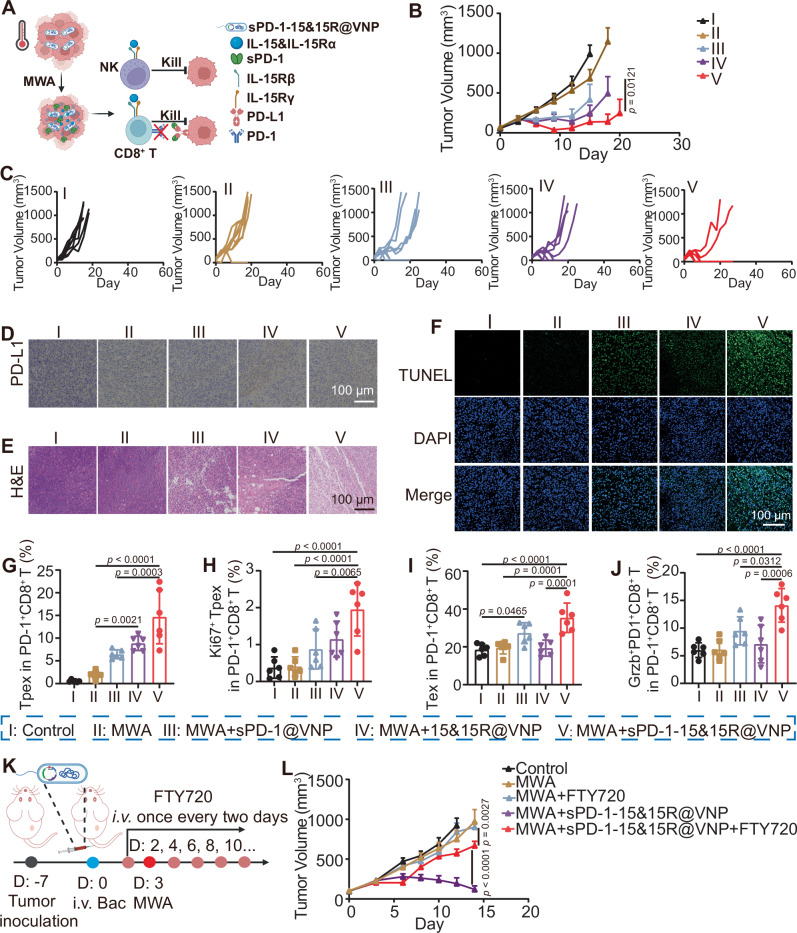
Fig. 7. Enhanced tumor regression by in situ promotion of Tpex cells through engineered sPD-1-15&15R@VNP.
A Schematic illustration of the mechanism by which engineered bacteria achieve simultaneous intratumoral ICB and sustained activation of immune cells under MWA initiation, the figure was created in BioRender. Yujie (2024) https://BioRender.com/b85q249. Tumor growth curves (B, group I and IV (n = 7 mice), group II, III, and V (n = 8 mice)), individual tumor growth curves (C), magnified PD-L1 staining images (D), magnified H&E staining images (E), and magnified TUNEL staining images (F) of tumor sections of CT26 tumor-bearing mice after different treatments as indicated. Data in B was presented as the mean ± SEM, p value was calculated by two-way ANOVA with Tukey’s multiple comparisons. Intratumoral percentages of Tpex cells (G, CD3+CD8+PD-1+TCF1+), Ki67+ Tpex cells (H, CD3+CD8+PD-1+TCF1+Ki67+), Tex cells (I, CD3+CD8+PD-1+TCF1−) and Grzb+PD-1+ T cells (J, CD3+CD8+PD-1+Grzb+) after different treatments as indicated (n = 6 mice). Data in G–J were presented as the mean ± SD, p values were calculated by one-way ANOVA with Tukey’s multiple comparisons. K Schematic illustration of the experiment design by using FTY720 to inhibit lymphocyte migration, the figure was created in BioRender. Yujie (2024) https://BioRender.com/r47l430. L Tumor growth curves of CT26 tumor-bearing mice after different treatments as indicated (group I, III, and IV (n = 7 mice), group II and V (n = 6 mice)). Data in L was presented as the mean ± SEM, p values were calculated by two-way ANOVA with Tukey’s multiple comparisons. MWA microwave ablation, Bac bacteria. Source data are provided as a Source Data file.

